
Figures & data
Table 1. Comparison of current major methodologies for urban CE accounting.
Figure 1. Accounting sectors (included in dotted rectangle) of Nanning’s CE based on the GPC framework.
Figure 2. Accumulative results of energy consumption CE from all industrial subsectors.
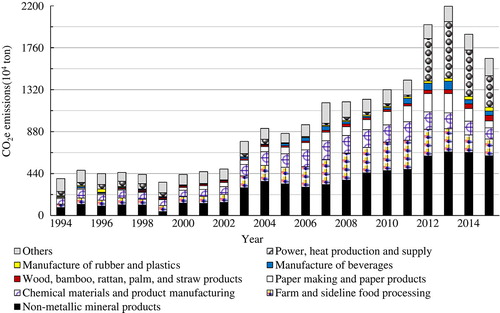
Figure 3. CO2e emissions from household (a) and commercial (b) energy consumption.
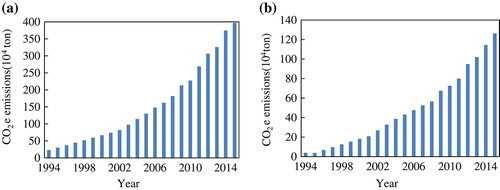
Figure 4. Accumulated CEs of different traffic tool types.
Figure 5. CO2e emissions from private cars, taxis and buses (a) and their respective shares (b).
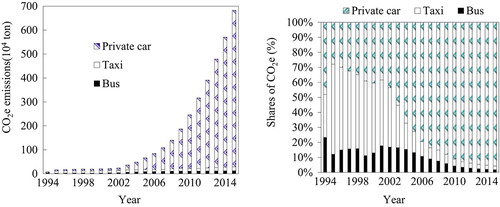
Figure 6. CO2e emissions from solid waste landfill (a) and wastewater treatment (b).
Figure 7. CO2e emissions from the industrial process sector.
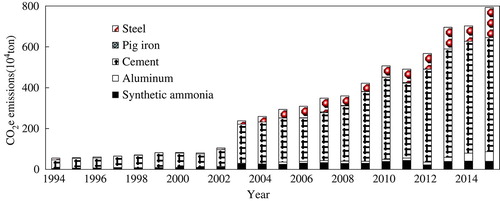
Figure 8. CO2e emissions from different fuel types.
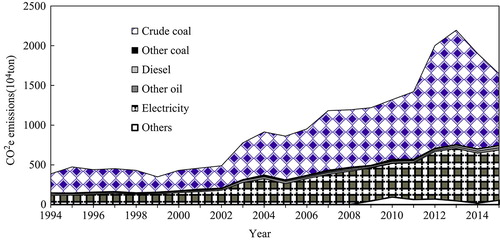
Figure 9. Total CE and different subsector CEs in Nanning city.
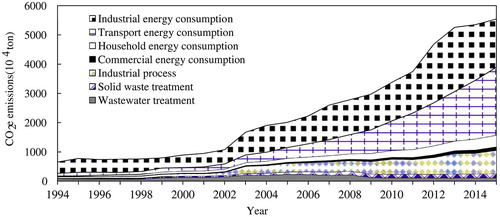
Table 2. Total CE, CEs per unit area, population, CEs per capita, GDP, CEs per GDP and the shares of primary, secondary and tertiary industries in Nanning city.
Figure 10. Electricity consumption-based CE (ECCE) containing commercial, household and industrial portions; electricity production-based CE (EPCE) was included in PHPS CE.
Table 3. Differences in four emission indicators in Nanning (NN), China (CN) and the world (WD).
Figure 11. Accumulative CE per capita of Nanning, China and World.
Table A1. CO2e emission factors of different type’s energy.
Table A2. Emission factor of electricity (t-CO2e/104kwh).