
Figures & data
Figure 1. Map of the geography and locations of the meteorological stations in Pukou District, China.
Source: Pukou Meteorological Bureau and Nanjing Land and Resources Bureau, 2015.
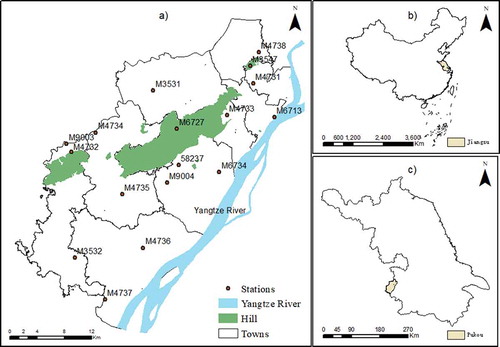
Table 1. Hierarchical index table of the impacts of rainstorm waterlogging disasters on different industries.
Figure 2. Error distribution of the waterlogging points during the rainstorm on 1 August 2008, in the urban area of Nanjing, China.
Source: Pukou Meteorological Bureau, 2015.
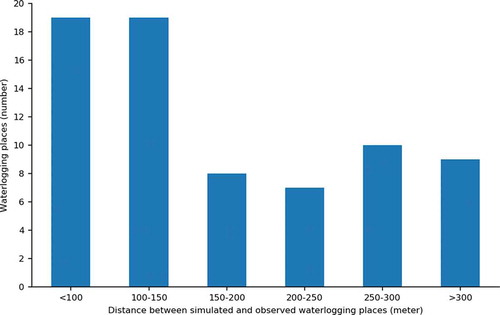
Figure 3. Accumulated precipitation (mm) in 30-minute intervals from 18:00 to 23:00 on 28 September 2014, at different stations in Pukou District, China.
Source: Pukou Meteorological Bureau, 2015.
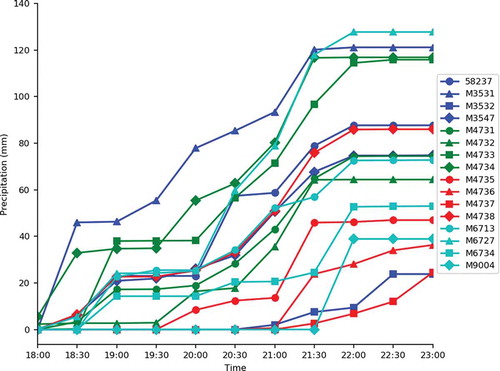
Figure 4. Resulting map of the interpolated precipitation from 18:30 to 23:00 on 28 September 2014, in Pukou District, China.
Source: Pukou Meteorological Bureau and Nanjing Land and Resources Bureau, 2015.
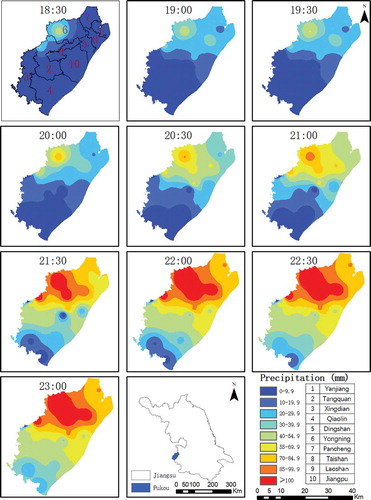
Table 2. Statistics of the numbers of people influenced by rainstorm waterlogging on every street at 21:30 on 28 September 2014, in Pukou District, China (unit: person).
Table 3. GDP statistics of the extent to which the economy was affected by the rainstorm waterlogging disaster on every street at 21:30 on 28 September 2014, in Pukou District, China (unit: million yuan).
Figure 5. Resulting map of the impact assessment of rainstorm waterlogging on the traffic and transportation industry at 21:30 on 28 September 2014, in Pukou District, China. Class 0 represents the lowest level; Class I represents the highest level and the most influential area.
Source: Pukou Meteorological Bureau and Nanjing Land and Resources Bureau, 2015.
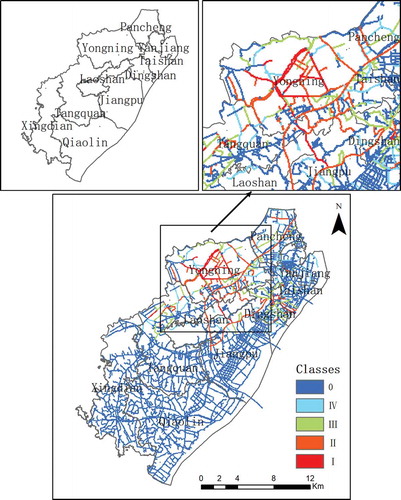
Figure 6. Line chart of the comprehensive impact assessment of rainstorm waterlogging on various industries from 18:30 to 23:00 on 28 September 2014, in Pukou District, China.
Source: Pukou Meteorological Bureau, 2015.
Figure 7. Line chart of the regional impact assessment of rainstorm waterlogging from 18:30 to 23:00 on 28 September 2014, in Pukou District, China.
Source: Pukou Meteorological Bureau, 2015.
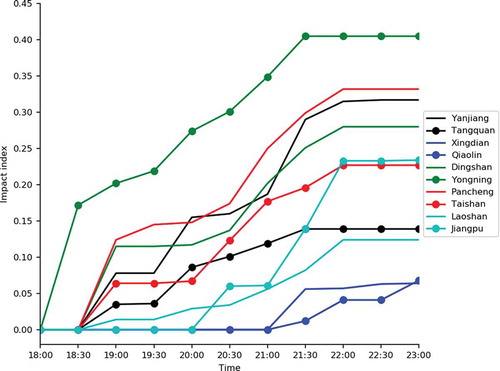
Figure 8. Line chart of the overall impact assessment of rainstorm waterlogging from 18:30 to 23:00 on 28 September 2014, in Pukou District, China.
Source: Pukou Meteorological Bureau, 2015.
Table 4. Land-use types corresponding to different industries.
Table 5. Statistical indicators of waterlogging for the population and the economy.
Table A1. Impact levels of rainstorm waterlogging points on 1 August 2008, in the urban area of Nanjing, China.