Figures & data
Figure 1. (a) Location of the study area, (b) the distributions of rain gauges, and (c) the average monthly rainfall over the eastern coastal areas of China from 2003 to 2015.
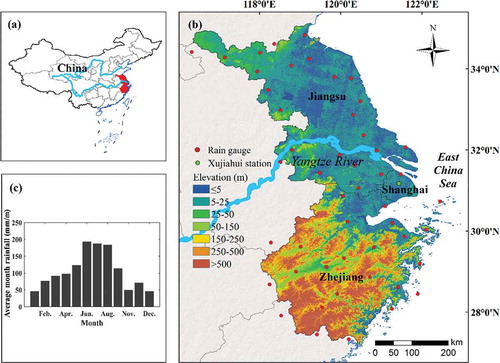
Table 1. Results of cross validation.
Table 2. The basic information on the three satellite-based products.
Table 3. The statistical indicators for evaluating the satellite-based products.
Figure 2. The scatter plots of the extreme rainfall amounts of (a) H50p, (b) R95p, (c) R99p from GRD and (1) 3B42V7, (2) CMORPH-RAW, and (3) CMORPH-CRT during the period 2003–2015.
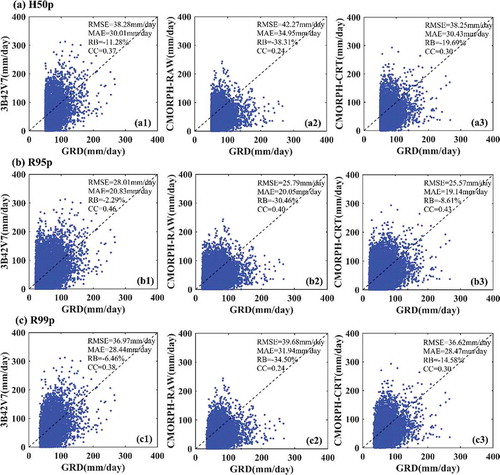
Table 4. The statistical results of satellite-based products for average extreme rainfall.
Figure 3. The spatial distributions of the average extreme rainfall of (a) H50p, (b) R95p, (c) R99p for GRD, 3B42V7, CMORPH-RAW, and CMORPH-CRT during the period 2003–2015.
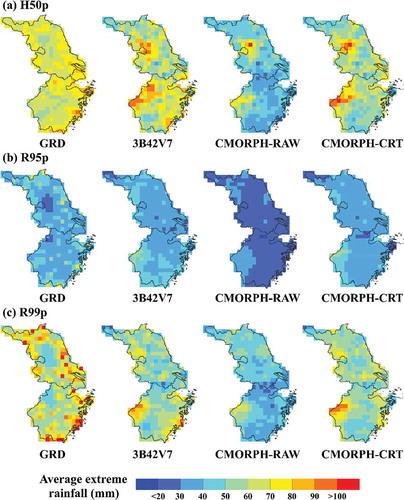
Figure 4. Two extreme rainfall time series of the Xujiahui station in 2015 and satellite-based product observations. (a) 16–17 June, (b) 27–28 June.
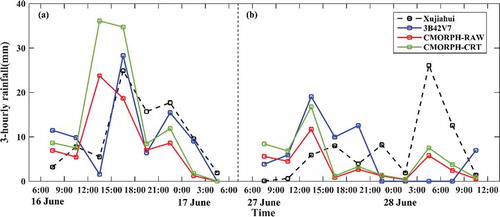
Figure 5. The RB of 3B42V7, CMORPH-RAW, and CMORPH-CRT in different daily rainfall levels.
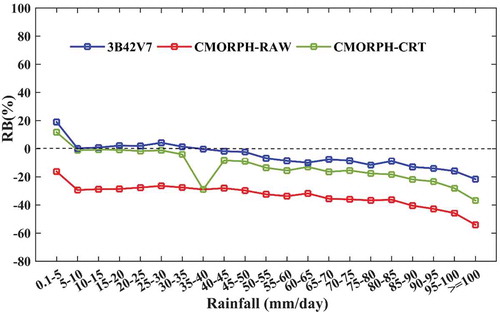
Figure 6. The overall detection capacity of the three satellite-based products in different daily rainfall thresholds.
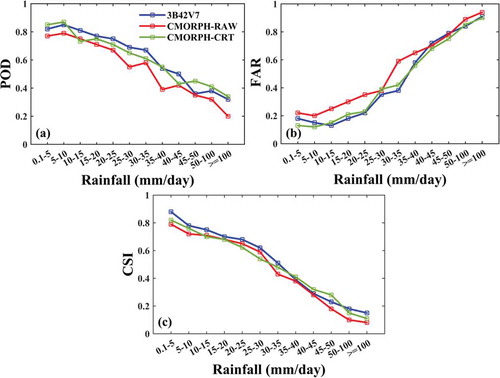
Table 5. The parameters used in potential flood simulating model.
Table 6. Archive of large flood events in the eastern coastal areas of China during 2003–2005.
Figure 7. The spatial distributions of the flood centroids and potential flood index (PFI) values of GRD, 3B42V7, CMORPH-RAW, and CMORPH-CRT in four flood events. (a) 23–28 June 2003, (b) 12–15 August 2004, (c) 16–20 July 2005, (d) 1–4 September 2005.
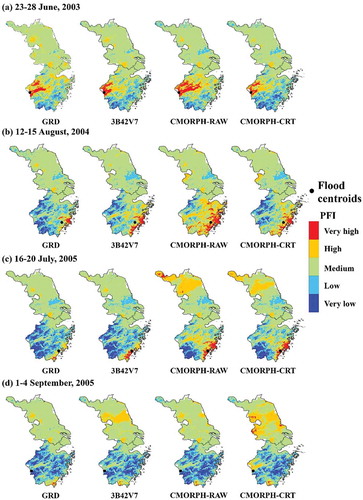
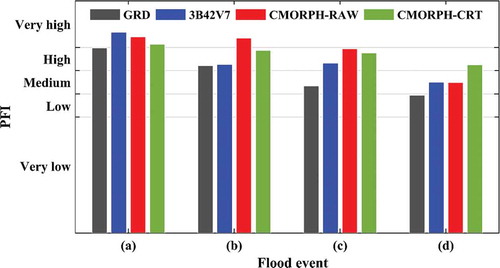
Figure 8. The PFI values of GRD, 3B42V7, CMORPH-RAW, and CMORPH-CRT at flood centroids in four flood events. (a) 23–28 June 2003, (b) 12–15 August 2004, (c) 16–20 July 2005, (d) 1–4 September 2005.