
Figures & data
Figure 1. Map of Mumbai (left) and location of Mumbai’s northwestern suburb Dahisar, the field study area (right). Source: OpenStreetMap; openstreetmap.org/copyright.
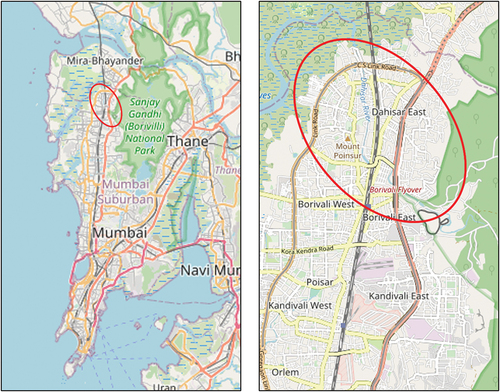
Figure 2. DRR and CCA policies and plans with relevance for flood risk governance in Mumbai. Source: Compiled by T. Zimmermann.
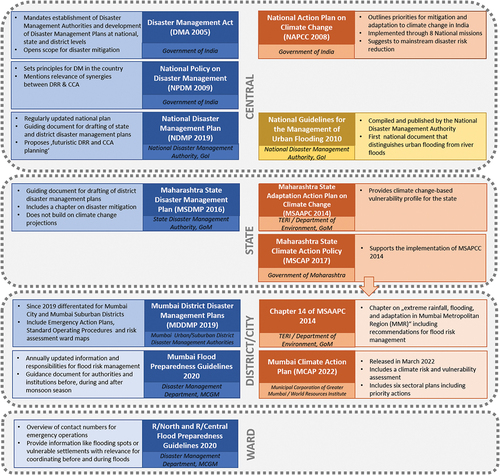
Table 1. Key flood-related interventions in Dahisar undertaken by the government authorities.
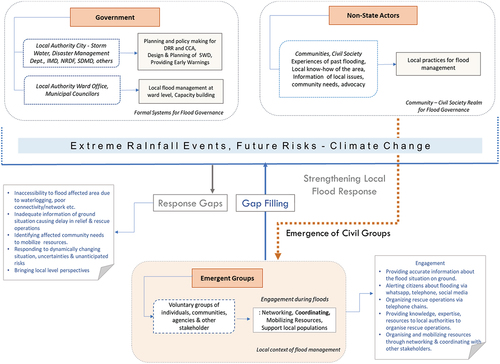
Figure 3. Emergent Groups in Urban flood risk governance. Source: Figure by S. Shinde
Supplemental material
Supplemental Material
Download MS Word (15.1 KB)Data availability statement
The data are not publicly available due to their containing information that could compromise the privacy of research participants. Certain data pertaining to the findings of this study are available on reasonable request from the corresponding author, TZ.