Figures & data
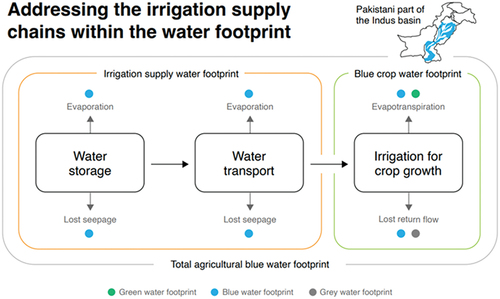
Figure 1. Schematic map of the major infrastructures in the Indus river basin irrigation network of Pakistan (Source: Nasir and Muhammad Citation2011).
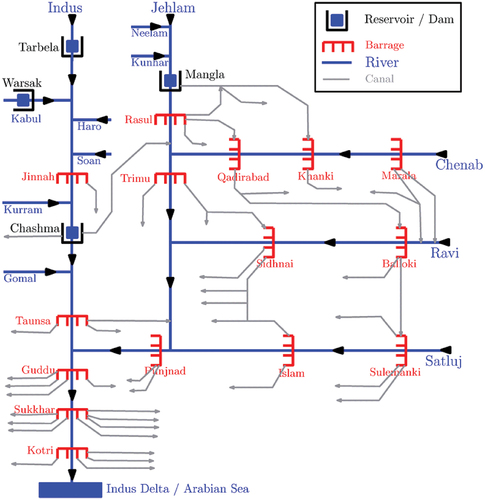
Figure 2. Basin- and field-scale level of the irrigation supply chain that includes water inflow from snowmelt and precipitation into the main river Indus and its tributaries, reservoir water storage, water transport to rivers, canals, and field channels, irrigation on the field, and drainage. In every link and between links of the supply chain losses occur.
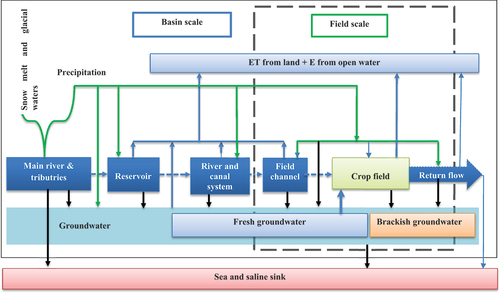
Table 1. Average blue WF of irrigation in the Indus basin in Pakistan from 1992 to 2016.
Figure 3. Average total agricultural and blue crop water footprints (including both surface and groundwater) (km3/year) per province (Punjab, Sindh, Balochistan, and Khyber Pakhtunkhwa (KPK), for Pakistan from 1992 to 2016.
Figure 4. Total agricultural and blue crop surface and groundwater water footprints (WFs) (km3/year) per province in Pakistan. Figure 4a gives the total agricultural blue surface WFs (km3/year), Figure 4b the total agricultural groundwater WFs (km3/year), Figure 4c the blue crop WFs of surface and groundwater (km3/year) and figure 4d the K value. (KPK is Khyber Pakhtunkhwa). The K factor refers to the ratio of the blue WFs of the irrigation supply chain and the blue crop WF (dimensionless).
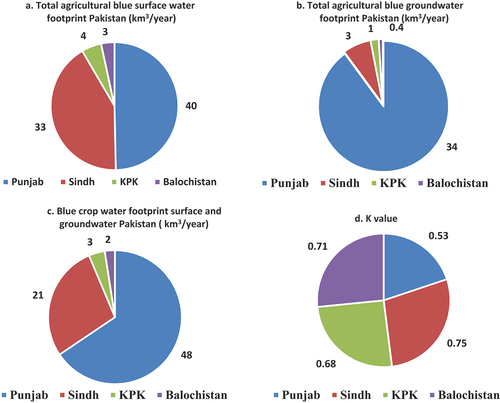
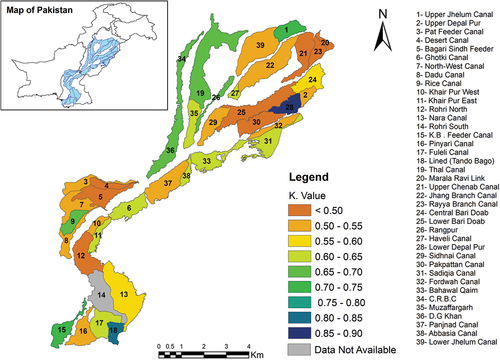
Figure 5. Map of K values per canal command area in the Indus basin of Pakistan. The K factor refers to the ratio of the blue WFs of the irrigation supply chain and the blue crop WF (dimensionless).