
Figures & data
Figure 1. Treatment Groups.
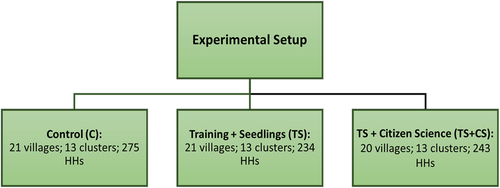
Table 1. Baseline respondent and household characteristics and outcome variable comparison.
Table 2. Comparison of attrition rates across treatment groups.
Table 3. Tests of internal validity for covariates and baseline outcome indicators.
Table 4. Difference in changes in FTT knowledge score.
Table 5. Proportions of HHs with newly planted shrubs with logistic regression output.
Table 6. Approximate % change in number of tree fodder shrubs reported on farm.
Table 7. Results of mediation analysis – FTT uptake through FTT knowledge.
