
Figures & data
Figure 1. Theory of change. Source: Own representation.
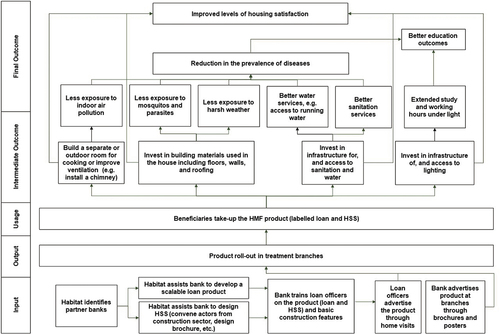
Figure 2. Evaluation sites that were selected to be part of this study. Source: Own representation.
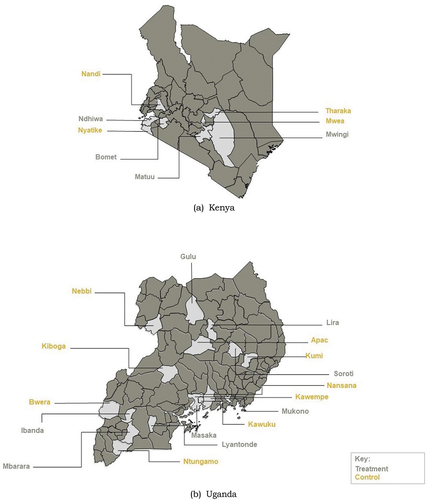
Figure 3. Timeline. Source: Own representation.
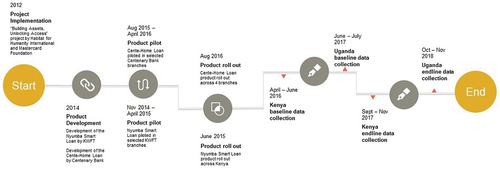
Table 1. Household balancing (baseline values).
Table 2. Balance across branches.
Table 3. Probit regression of loan take-up on baseline characteristics (treatment sample only).
Figure 4. Propensity scores histograms of adopters and comparison households. Adopters are households in treatment branches that took up the product, while comparison households are existing clients in non-treated branches.
Table 4. Pre- and post-matching balancing.
Table 5. Primary treatment effects in Kenya and Uganda.
Table 6. Secondary treatment effects in Kenya and Uganda.
Figure A1. Comparison of loan usage.
Table A1. Comparison of loans.
Table A2. ‘Perceived Stress Scale’ questions.
Table A3. Sample attrition.
Table A4. Variable descriptions.
Table A5. Impacts on non-adopters in treatment branches.
Table A6. Robustness: Dwelling characteristics.
Table A7. Robustness: Services & protection.
Table A8. Robustness: Satisfaction & pride.
Table A9. Minimum detectable effects for dwelling characteristics.
