
Figures & data
Figure 1. Field picture of the studied area.
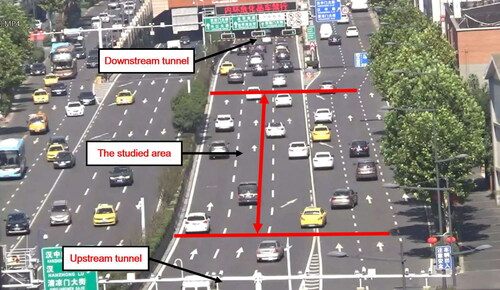
Figure 2. Traffic movements of two kinds of inter-tunnel weaving section.
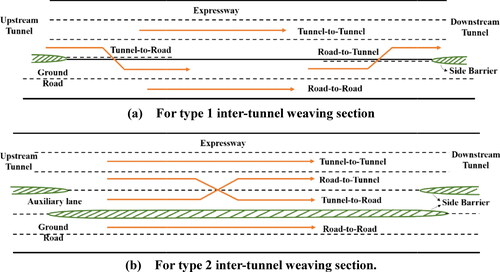
Figure 3. Subsection division of two types of inter-tunnel weaving section.
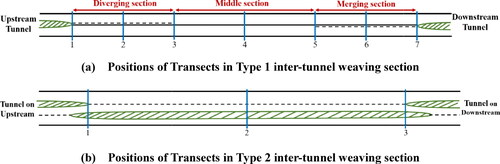
Table 1. Selected weaving sections and geometric characteristics.
Figure 4. Types of conflicts.
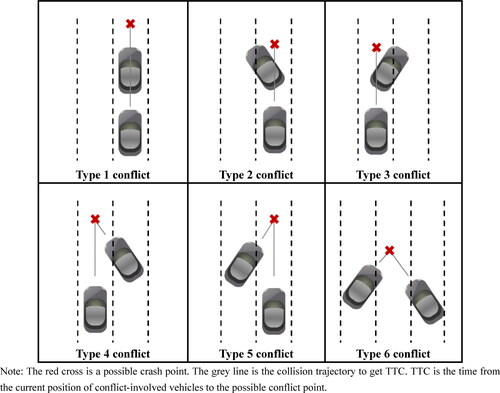
Table 2. Six conflicts types.
Figure 5. Distribution of total traffic volume over the inter-tunnel weaving section.
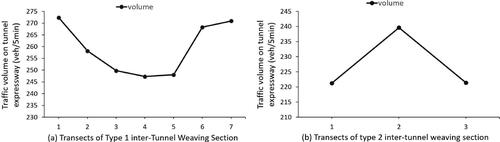
Figure 6. Distribution of weaving traffic volume over the inter-tunnel weaving section.
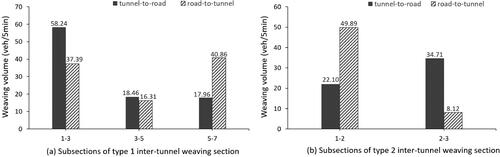
Figure 7. The speed variation along the inter-tunnel weaving section.
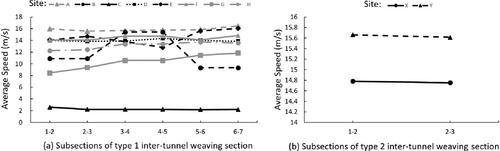
Figure 8. Spatial distribution of different types of conflicts in type 1 and type 2 inter-tunnel weaving section.
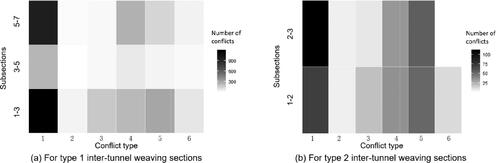
Table 3. Candidate variables in the model.
Table 4. Descriptive statistics of variables.
Table 5. Fixed-effect conflict prediction models for the whole weaving section.
Table 6. Random-effect conflict prediction models for the whole weaving section.
Table 7. Fixed-effect conflict prediction models for sub-sections of type 1 weaving section.
Table 8. Random-effect conflict prediction models for sub-sections of type 1 weaving section.