
Figures & data
Figure 1. National road traffic accident fatalities per 10,000 vehicles and growth rate, China, 2011–2020.
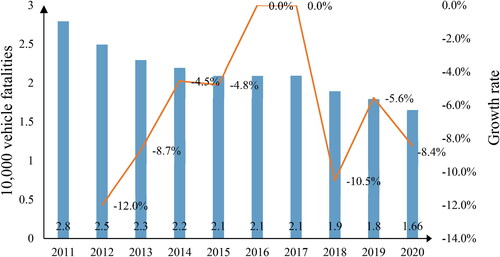
Figure 2. General methodology framework of this study.
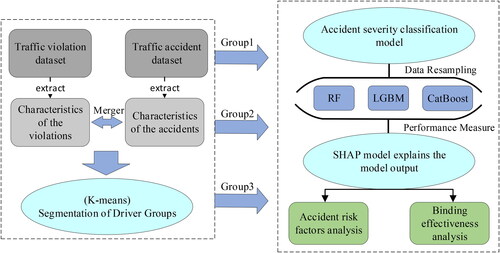
Figure 3. Joint distribution of cumulative violations and accident severity: (a) cumulative number of violations; (b) cumulative penalty points for violations; (c) cumulative amount of fines.
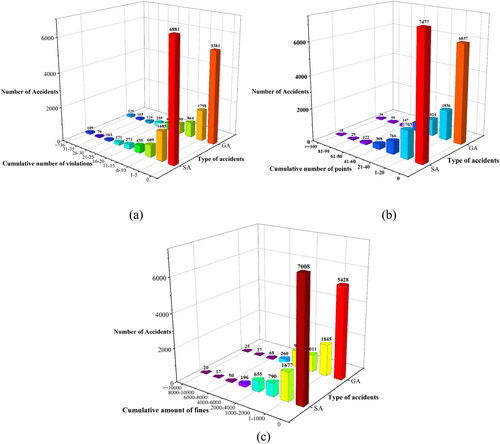
Figure 4. Evaluation of clustering effects: (a) Elbow Method; (b) Silhouette Coefficient.
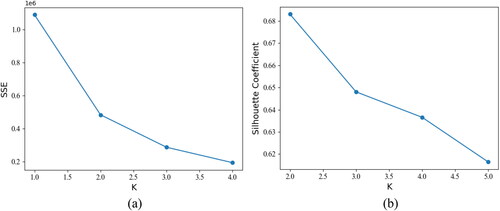
Figure 5. Distribution of cumulative number of violations and accidents severity.
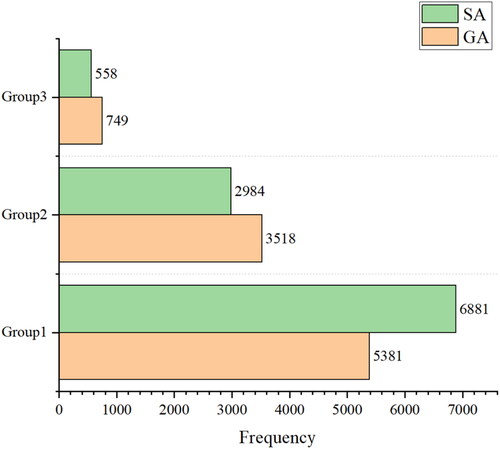
Figure 6. Hyperopt on RF tuning.
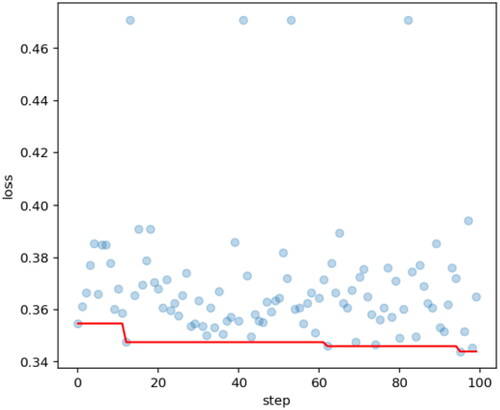
Table 1. CatBoost parameter tuning results.
Table 2. Criteria used by AUC to judge the merit of classifiers (Ling et al., Citation2003).
Figure 7. Model performance: (a) AUC; (b) F_Score.
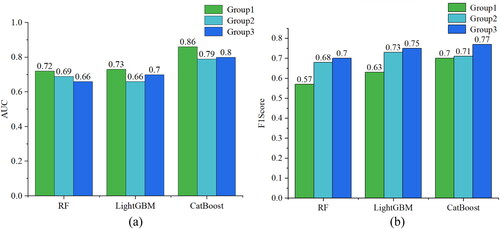
Figure 8. Feature importance on accident severity: (a) Group 1; (b) Group 2; (c) Group 3.
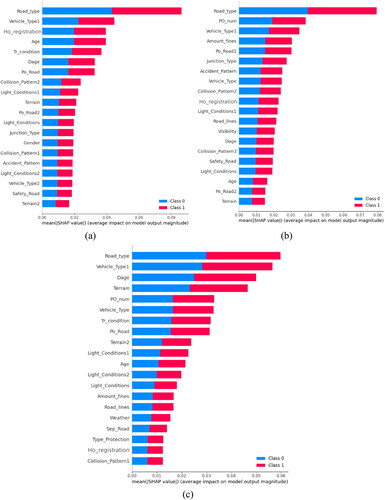
Figure 9. SHAP summary plots of SA: (a) Group 1; (b) Group 2; (c) Group 3.
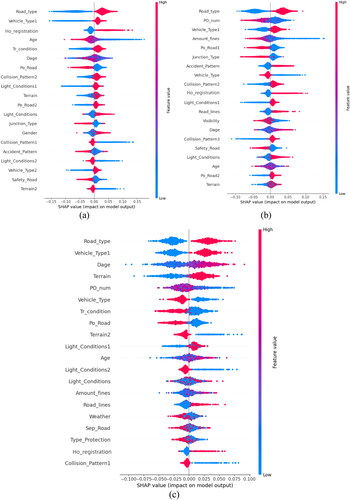
Figure 10. SHAP dependency plots of cumulative amount of fines: (a) Group2; (b) Group3.
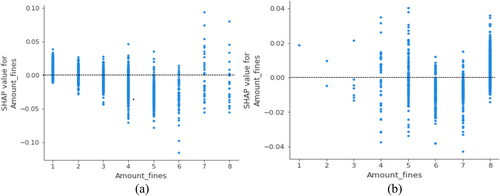
Figure 11. SHAP dependency plots of cumulative penalty points for violations: (a) Group2; (b) Group3.
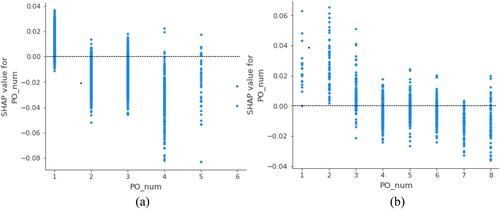
Table 3. Fines and penalty points codes.
Table A1. Definition table of attribute variable categories.