Figures & data
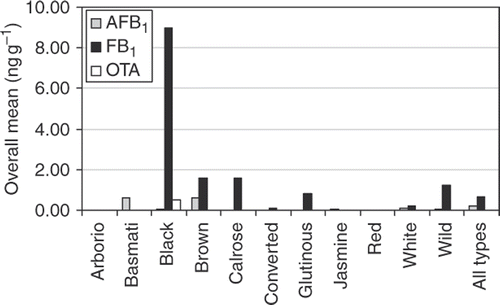
Figure 1. Yearly variation of AFB1 in Canadian retail rice, expressed as a normal distribution plot. There were not enough positives in both years to conduct year-to-year comparisons for the other two mycotoxins.
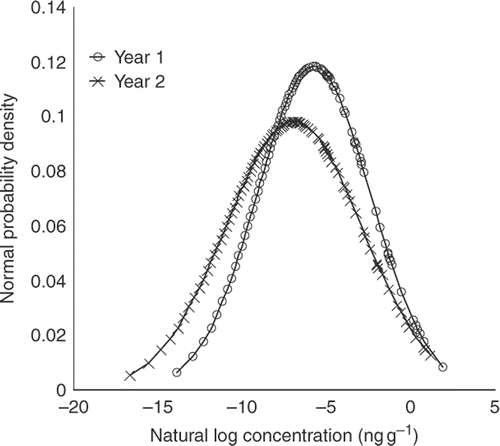
Table 1. Samples with a positive fumonisin contamination in rice collected in 2008.a
Figure 2. Overall means of AFB1, FB1 and OTA for each type of rice sample collected in 2008. Except where colour is indicated, rices are white.