Figures & data
Table 1. Analytical methods used by the expert laboratories.
Table 2. Average measurements reported by the expert laboratories (Xn), their expanded measurement uncertainties (Un), assigned values, standard uncertainty contributions (from characterisation, homogeneity and stability) and combined uncertainties (uref) and the standard deviation for the PTs assessment (mg kg−1).
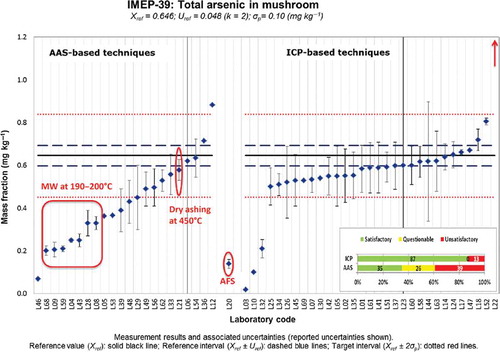
Figure 1. (colour online) Xlab and Ulab as reported by the participants in IMEP-39 and IMEP-116 for the total mass fraction of Cd.
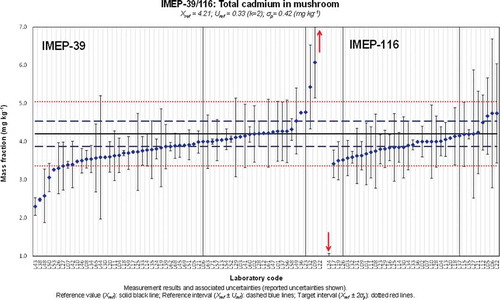
Figure 2. (colour online) Xlab and Ulab as reported by the participants in IMEP-39 and IMEP-116 for the total mass fraction of Pb.
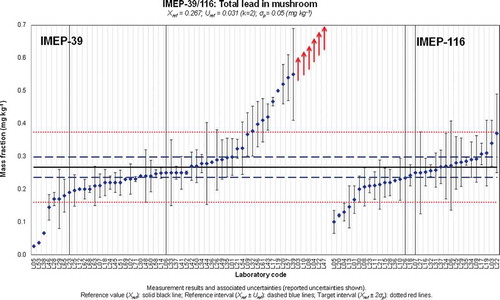
Figure 3. (colour online) Xlab and Ulab as reported by the participants in IMEP-39 and IMEP-116 for the total mass fraction of As.
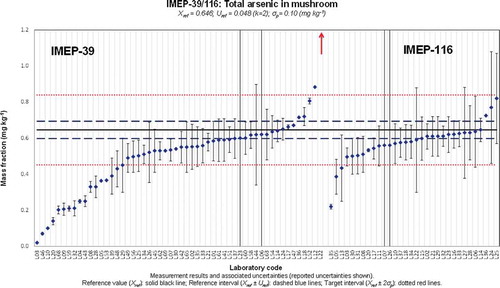
Figure 4. (colour online) Xlab and Ulab as reported by the participants in IMEP-39 and IMEP-116 for the total mass fraction of Hg.
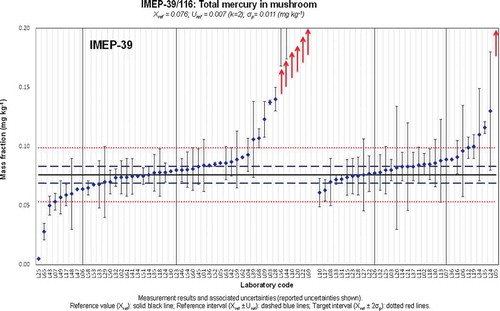
Figure 5. (colour online) Xlab and Ulab as reported by the participants in IMEP-39 and IMEP-116 for the total mass fraction of iAs.
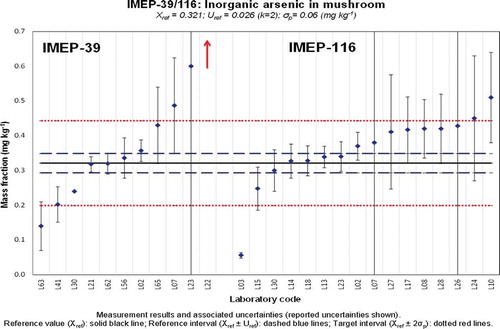
Figure 6. (colour online) Distribution of satisfactory, questionable and unsatisfactory (a) z- and (b) ζ-scores for IMEP-39 and IMEP-116.
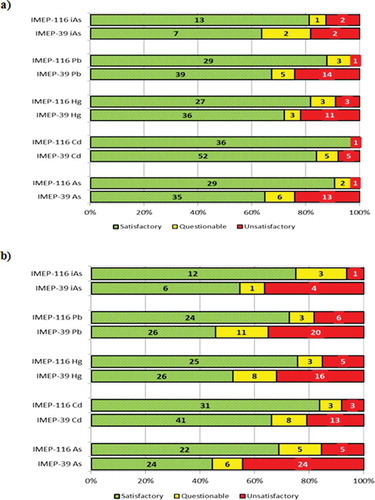
Table 3. Uncertainty assessment. Proportion of participants in each study who received the ‘a’, ‘b’ or ‘c’ ratings (%).
Figure 7. (colour online) Chromatograms showing the distribution of As species in the test item, as obtained by two expert laboratories using anion exchange-ICP-MS.
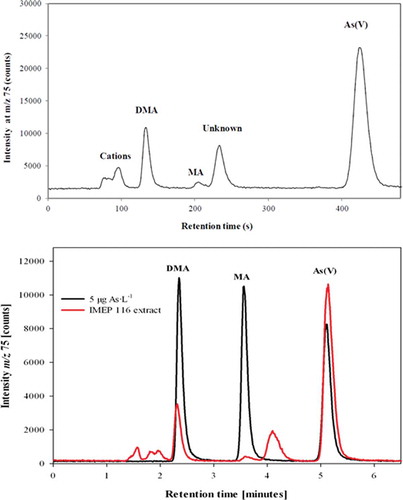
Figure 8. (colour online) Distribution of results reported for the total mass fraction of As on the basis of the technique used.