
Figures & data
Figure 1. Structure of toxins: logP and pKa values.
Table 1. Ion source settings on Ultima PT and Thermo TSQ Quantum instruments.
Table 2. MS/MS ion transitions, settings, and ion ratios on Ultima PT and TSQ Quantum instruments.
Table 3. Calculated and confirmed analytical limits: validation levels, linearity parameters and matrix effects.
Figure 2. (colour online) (a) Quantifier MRM chromatograms of a spiked tomato sample. Spiking levels are 50 µg kg–1 for ALT, 5 µg kg–1 for CIT, 5 µg kg–1 for AOH, 5 µg kg–1 for TEN, 10 µg kg–1 for TEA and 2 µg kg–1 for AME; (b) quantifier MRM chromatograms of a blank tomato sample. All analyses were performed on an Ultima PT instrument.
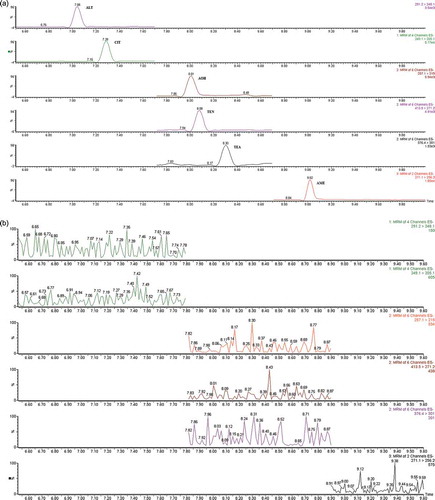
Table 4. Recovery, repeatability, intermediate precision, and relative expanded uncertainty.
Table 5. Detected concentrations in the proficiency test samples and in the standard solution (Z-scores).