Figures & data
Table 1. MS/MS parameters for N-isopropyloctopamine.
Figure 1. (colour online) Principal and schematic presentation of the multiplex bead-based β-agonist assay.
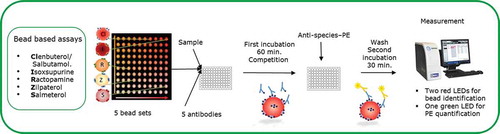
Table 2. Results of initial targeted chemical analysis by LC-MS/MS for plant toxins and selected stimulants.
Figure 2. Controls and the three batches of the supplement as tested in the competitive radioligand β2-adrenergic receptor binding assay.
Table 3. Results of controls and the three batches of the supplement as tested in the clenbuterol and salbutamol ELISAs.
Figure 3. Results (% B/B0) of a β-agonist mixture (1–4), a chemical blank (5) and sample extracts of three batches of the supplement causing hart problems (6–8) tested in a newly developed multiplex bead-based β-agonist assay.
Figure 4. Experimental (top) and simulated (bottom) profile mass spectrum of C11H17NO2 + H+ (resolving power 50 000 full width at half maximum). The zoomed-in detail on the right shows the 15N13C isotope cluster (15N being the shoulder on the left-hand side of the mass peak). Relative abundance of the isotopes are indicated in the boxes.
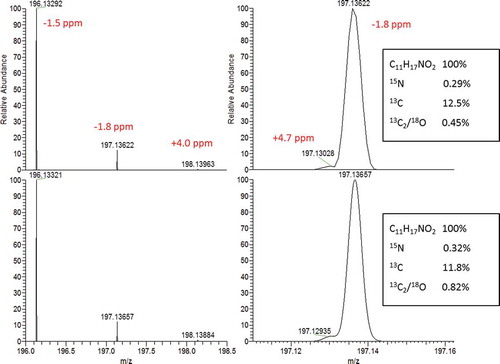
Figure 5. Controls, IPO standards (Deterenol) and the three batches of the supplement as tested in the competitive radioligand β2-adrenergic receptor binding assay.
Figure 6. Response of standard series of clenbuterol (clen) in the ‘clenbuterol’ ELISA (left y-axis) and of salbutamol (salb) and IPO in the ‘salbutamol’ ELISA (right y-axis).
Figure 7. Results (% B/B0) of N-isopropyloctopamine (IPO) tested in a newly developed multiplex bead-based β-agonist assay for screening feed and food samples.