
Figures & data
Figure 1. ELISA data plotted against LC-MS/MS data with linear regression statistics.
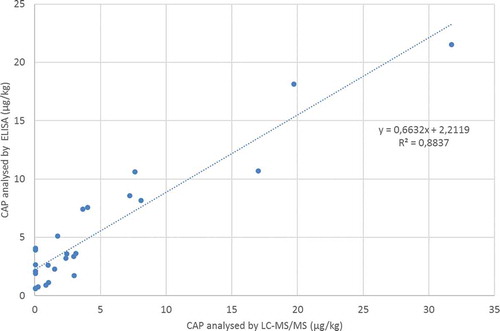
Figure 2. (colour online) Box–Whisker plot of the results of analysis of CAP by LC-MS/MS (LOQ = 0.1, LOD = 0.05) and ELISA (minimum observed level = 0.6) respectively. All values are in µg kg–1. Boxes represent second and third quartiles with median (horizontal line) and mean (×) indicated.
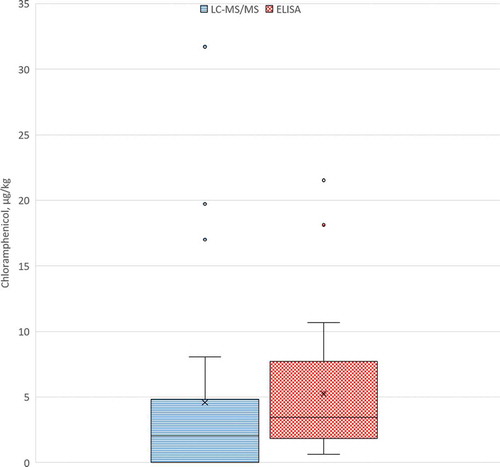
Figure 3. Geographical distribution of samples with indication of CAP content. Open circles: < 1 µg kg–1; grey circles 1–10 µg kg–1; black circles > 10 µg kg–1.
Table 1. Summary of results of content of chloramphenicol in straw sampled in Northwest Europe grouped per country of origin.
Table 2. Summary of results of analyses of chloramphenicol in cereal straw sampled at Swedish farms.
Table 3. Regional distribution in Sweden of straw samples containing more than 1 µg/kg CAP.