Figures & data
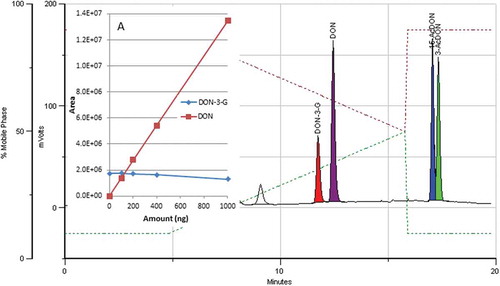
Figure 1. (colour online) Recoveries obtained with IACs columns marketed by the main suppliers tested at three loading levels (a- 40; b- 200; and c- 400/1000 ng). Error bars represent the result of duplicates. DONaokin was just tested once at each level.
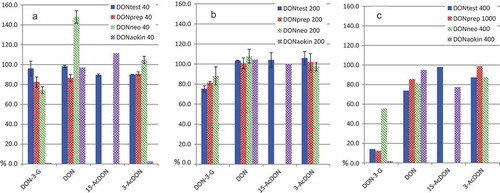
Figure 2. (colour online) Chromatogram of a mixture of DON and conjugates. The IAC column was loaded with 10 ml of an extract obtained from a sample containing 100 µg kg−1 each (corresponding to 200 ng each analyte).
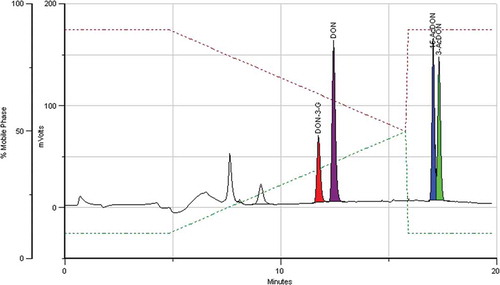
Figure 3. (colour online) Calibration curves obtained with IAC enrichment/clean-up followed by HPLC-PCD-FLD of aqueous solutions containing analyte amounts in the range of 20 to 1000 ng (10 to 500 µg kg−1).
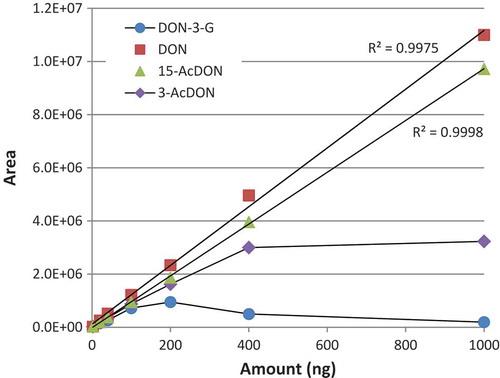
Figure 4. (colour online) Influence of increasing concentrations of DON (a), 15-AcDON (b) and 3-AcDON (c) on the response of DON-3-G (100 µg kg−1, 200 ng) when loaded onto an IAC with a stated capacity of 1250 ng for DON.
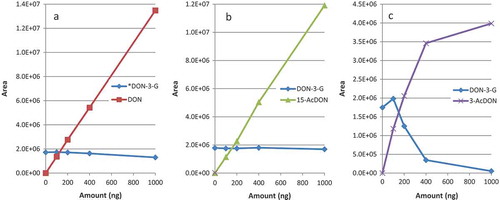
Table 1. Amount of DON and conjugates retained in three IAC columns (I–III) in a stacked experiment to demonstrate competition between analytes for the antibodies in the IAC. Recoveries are also given.
Figure 5. (colour online) Plot of the response obtained for increasing loading amounts of DON-3-G, in the range from 20 to 1000 ng in MilliQ water (equivalent to 10 to 500 µg kg−1).
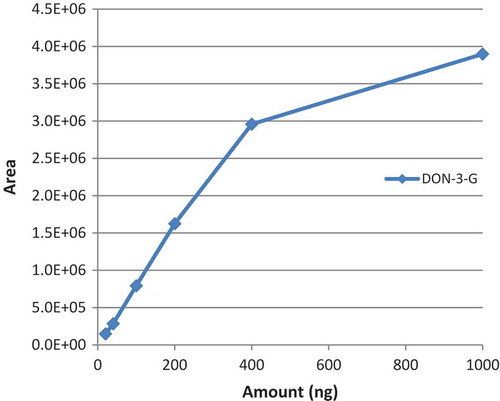
Figure 6. (colour online) IAC-HPLC-PCD-FLD chromatogram of a maize sample contaminated with the following concentrations: DON – 131 µg kg−1 / DON-3-G – 17 µg kg−1 / 15-AcDON – 23 µg kg−1 and 3-AcDON – 9.8 µg kg−1.
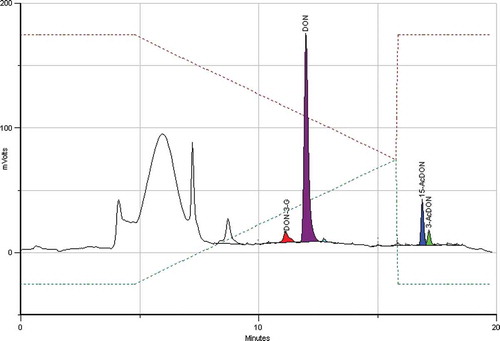
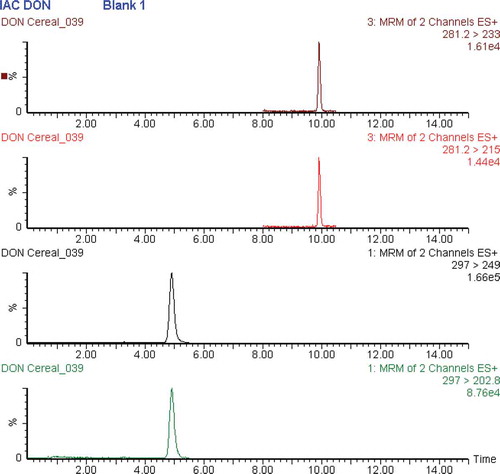
Figure 7. (colour online) Extracted ion chromatogram displaying DON (RT-4.91 min) and DOM (RT-9.92 min) peaks obtained from a blank IAC column.