Figures & data
Table 1. Sample preparation by focused ultrasound: central composite design and the results of analysis expressed in terms of particle size (nm) at minute 65 when the cross-flow of the separation method is finished. The experimental design was based on sonication amplitude (%) and sonication time (min). The target value for the response was 200 nm as given in the JRC report.
Table 2. AF4 system: Factors studied by a Full Factorial Design (FFD) for the optimisation of the AF4 system with the JRCNM0-1004a material at three levels which show the studied range. The instrumental factors are: cross-flow (CF), detector flow (DF), focusing time (Ft) and the exponential decay of the cross-flow (CFexp). The statistical assessment showed that exclusively CF and DF turned out to be significant and therefore only these parameters were included in the CCD.
Table 3. AF4 system: central composite design using the statistically significant factors cross-flow (CF) and detector flow (DF) identified in the previous full-factorial design (FFD) and the results of analysis expressed in terms of the particle size (nm) at minute 65. The experiments were performed with the JRCNM0-1004a material.
Figure 1. Illustrative images of JRCNM0-1004a material obtained by scanning electron microscopy as such and after different treatments: (a) deposited solid test material on a carbon stub; (b) the same experiment as in (a) but with higher magnification; (c) test material dispersed in NaPP 0.1%; and (d) test material after sonication at 60% during 5 min.
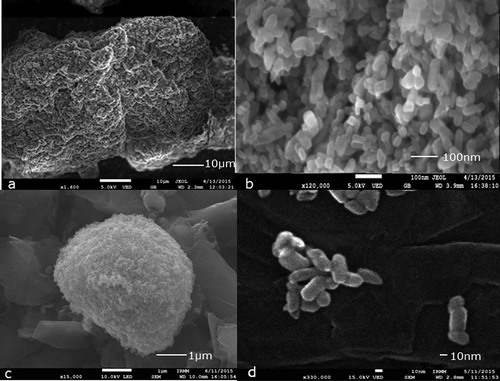
Figure 2. Statistical evaluation of the sample preparation by focused ultrasound: response surface and contour plot of JRCNM0-1004a (TiO2) in which particle size (nm) measured at 65 min is plotted against the amplitude/power (19–61%) of the ultrasound system and the sonication time (1.5–11.5 min).
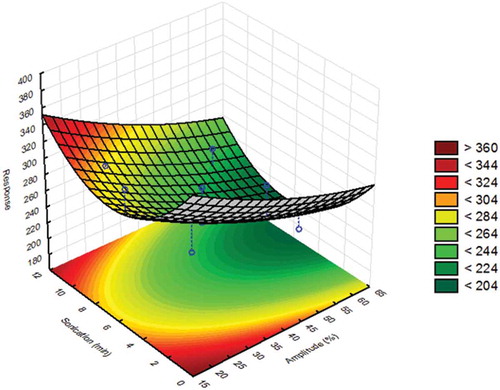
Figure 3. (colour online) Pareto chart of the factors influencing the measured particle size of the AF4 method: the effects of the factors and corresponding interactions were considered significant when their corresponding values were larger than the reference value (p = 0.05), indicated by a vertical red line. Interactions were shown by the corresponding number. For instance, ‘1 by 2’ indicated the interaction of cross-flow (1) and detector flow (2).
Note: Power flow = CFexp.
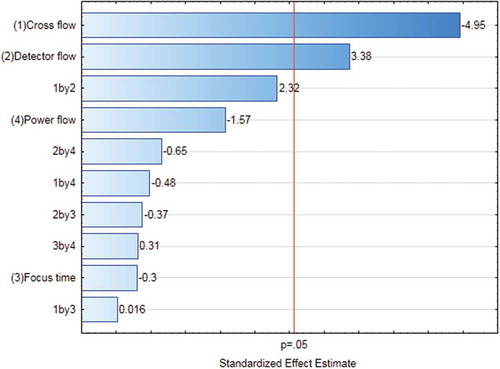
Figure 4. Statistical evaluation of the AF4 system: response surface of JRCNM0-1004a (TiO2) in which the particle size (nm) measured at 65 min is plotted against cross-flow (CF, range = 0.75–2.45 ml min–1) and detector flow (DF, range = 0.1–0.45 ml min–1). A value of 200 nm for the measured particle size was considered as optimum.
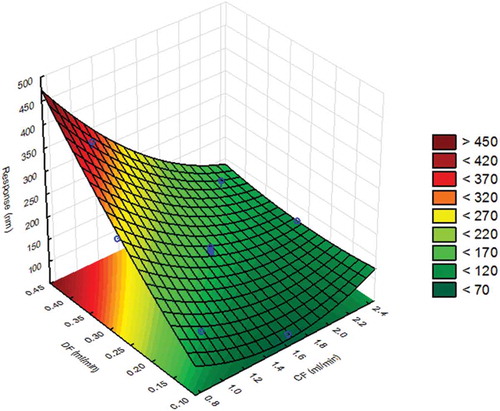
Figure 5. (colour online) Dynamic light scattering (DLS) intensity (blue) and particle size distribution (hydrodynamic diameter; red) plotted versus time obtained for 10 replicate measurements of JRCNM0-1004a by applying the optimised AF4 protocol and performed over 24 h. The different curves and distributions coincided very well, thereby demonstrating the very good repeatability of the measurement system and the stability of the sample over 24 h.
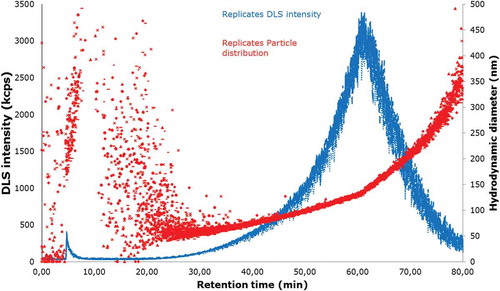
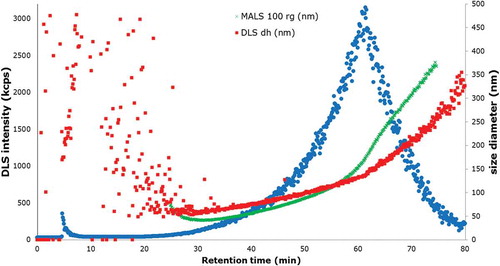
Figure 6. (colour online) Fractogram obtained from the AF4-MALS-DLS, DLS signal (blue) showing the elution profile of the JRCNM0-1004a; dh, hydration diameter obtained by DLS (red squares); rg, radius of gyration obtained by MALS at an angle of 100° converted into diameter (green crosses).