
Figures & data
Table 1. Overview of material used in the study.
Figure 1. Seven types of bone fragments in teleost fish: a, b: type 1 (herring and anchovy); c: type 2 (trout); d, e: type 3 (tuna and mackerel); f: type 4 (cod); g: type 5 (plaice); h: type 6 (flounder); and i: type 7 (sea robin). Bar = 50 µm.
Figure 2. (colour online) Profiles of seven fish bone types for 17 different species. Indications of orders are arranged according to evolutionary development.
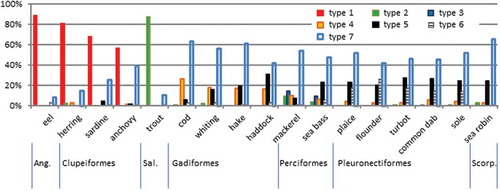
Figure 3. Filament extracted from the gill arch of sardine. Bar = 100 µm.
Figure 4. Different types of gill filament fragments: (top) anchovy, (bottom) cod. Note the presence of the distinct palisade layer (top image). Bar = 50 µm.
Figure 5. Share of cellular (types 1–5) and acellular (types 6 and 7) fish bone types for 17 different species. Indications of orders are arranged according to evolutionary development.
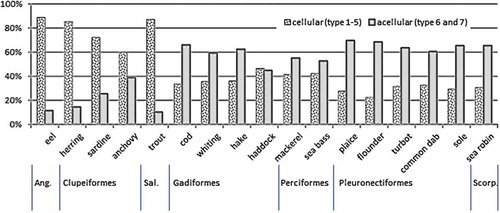
Table 2. Scale types and their distribution over the teleost fish orders represented in this study.
Table 3. Recovery of fish bone fragments in mixtures of mineral:fish of 9:1 with four different fish meals. Results are shown for unstained material and material stained with alizarin. Type means share of acellular bone fragments.
Figure 6. Simplified evolutionary tree of teleost fish, based on Near et al. (Citation2012) and Broughton et al. (Citation2013). Rectangle sizes indicate the relative portion of species per group, with the share of cellular species (left, dashed) and acellular species (right, blank) after Kranenbarg (2005). The Ostariophysi is a paraphyletic superorder according to molecular evidence, but is maintained here for its relation with data on (a) cellular bone occurrence.
Table 4. Specificity (column indicated with 0%) and sensitivity (columns indicated with percentages above 0%) related to fish meal detection in proficiency tests over a period of six years, organised by EURL AP or RIKILT on behalf of IAG section feed microscopy. EURL results are recalculated to a ‘zero tolerance’ approach. EURL and IAG reports are referenced by their first author, Veys and van Raamsdonk, respectively.