
Figures & data
Table 1. Chemical structures of the FWAs studied.
Figure 1. HPLC-FLD chromatogram of Simulant D1 fortified with FWAs standard mixture.
Peak order and mass fractions: 1 = 1,2-bis (5-methyl-2-benzoxazole) ethylene, 3.6 min, 3.0 µg kg−1; 2 = 1,4-bis-(2-benzoxazolyl)-naphthalene, 12.4 min, 3.0 µg kg−1; 3 = FCM 422, 14.4 min, 5.0 µg kg−1; 4 = FCM 919, 20.2 min, 5.0 µg kg−1; 5 = FCM 920, 21.2 min, 5.0 µg kg−1; 6 = FCM 500, 21.7 min, 5.0 µg kg−1.
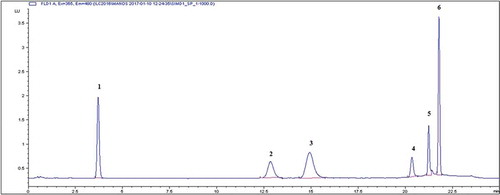
Table 2. Combined method performance characteristics in fortified food simulants A, C and D1 with FWAs standard mixtures (300 μg kg−1).
Table 3. Linearity, linear range and sensitivity results of the method developed for food simulants A, C and D1.
Table 4. Mass fractions (μg per kg of plastic) of the tested FWAs in the tested plastic cup specimens as obtained after ASE and Soxhlet extraction with ethanol.