
Figures & data
Table 1. Formulation of the four experimental diets. IM-0 = control diet without insect meal (IM) inclusion; IM-33, IM-66 and IM-100 = 33%, 66% and 100% replacement level of FM with IM, respectively.
Table 2. Concentrations (mg kg−1) of cadmium (Cd), mercury (Hg), lead (Pb) and fluorine (F) converted to moisture content of 12%, in the experimental diets. EU maximum levels in complete feed for fish relative to a feed with moisture content of 12 %, according to Directive 2002/32/EC (and amendments) on undesirable substances in animal feed. Actual concentrations in the samples in parentheses (mg kg−1 wet weight basis). IM-0 = control diet without insect meal (IM) inclusion; IM-33, IM-66 and IM-100 = 33%, 66% and 100% replacement level of FM with IM, respectively.
Table 3. Concentrations (mg kg−1) of total arsenic (totAs), inorganic arsenic (iAs), arsenobetaine (AB), dimethylarsenate (DMA) and unidentified arsenic species (UAs) in the insect meal (IM), the experimental diets and the fish fillet. Concentrations in the experimental diets are converted to moisture content of 12%, while actual concentrations in the samples in parentheses (mg kg−1 wet weight basis). IM-0 = control diet; IM-33, IM-66 and IM-100 have 33%, 66% and 100% replacement level of FM with IM, respectively.
Figure 1. Concentrations (mg kg−1 ww) of total arsenic in fillet (NQC) of Atlantic salmon fed diets with increasing inclusion of insect meal. IM-0 = control diet without insect meal (IM) inclusion; IM-33, IM-66 and IM-100 = 100% replacement level of FM with IM, respectively. Values are means, with their standard deviations represented by vertical bars. Different letters indicate significant differences (P< .05; linear regression) (R2 =Adjusted R-squared).
Figure 2. Chromatogram of the insect meal (IM) analysed by cation-exchange HPLC-ICPMS. The major arsenic peaks are dimethylarsinate (DMA) and unidentified arsenic species, eluted in the void and later in the chromatogram (retention time (r.t.) 8–12 min). Arsenobeatine (AB) is the minor arsenic peak with r.t. 6 min.
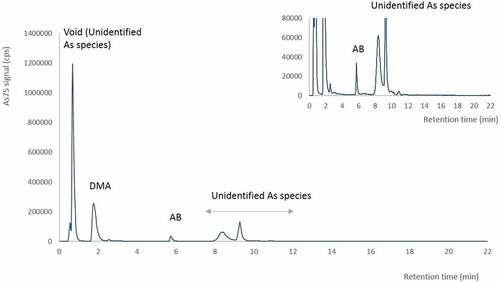
Figure 3. Chromatograms of the organic arsenic species in the diets (overlay of diet IM-0, IM-33, IM-66 and IM-100) analysed by cation-exchange HPLC-ICPMS. The major arsenic peaks are in the void of the chromatogram (< r.t. 1 min) being unidentified arsenic species, dimethylarsinate (DMA) and arsenobetaine (AB). Minor unidentified arsenic species are detected later in the chromatogram (r.t. 8–15 min). The enlargement shows the full signal scale for AB.
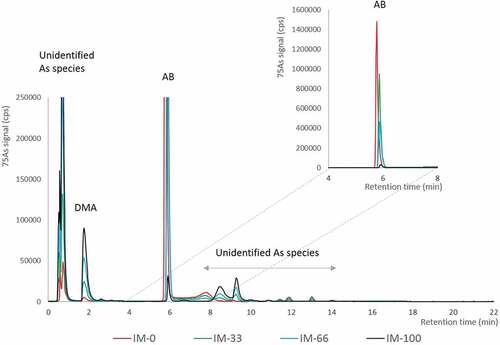
Table 4. Concentrations of POPs converted to moisture content of 12% in the experimental diets: the sum of polychlorinated dibenzodioxins (PCDD), polychlorinated dibenzofurans (PCDF), dioxin-like polychlorinated biphenyls (DL-PCBs) (ng WHO05 TEQ kg−1 wet weight), non-dioxin like polychlorinated biphenyls (NDL-PCBs) and polybrominated diphenyl ethers (PBDEs) (µg kg−1 wet weight), organochlorine pesticides (ng g−1 wet weight). EU maximum levels (ML) in compound feed for fish relative to a feed with moisture content of 12 %, according to Directive 2002/32/EC (and amendments) on undesirable substances in animal feed. Actual concentrations in the samples in parentheses. IM-0 = control diet without insect meal (IM) inclusion; IM-33, IM-66 and IM-100 = 100% replacement level of FM with IM, respectively.
Table 5. Concentration (µg kg−1) mycotoxins converted to moisture content of 12%, in the experimental diets. EU maximum levels in complete feed for farmed animals relative to a feed with moisture content of 12 %, according to Directive 2002/32/EC (and amendments) on undesirable substances in animal feed. Actual concentrations in the samples in parentheses (µg kg−1 wet weight basis). IM-0 = control diet without insect meal (IM) inclusion; IM-33, IM-66 and IM-100 = 100% replacement level of FM with IM, respectively.