Figures & data
Figure 1. Sampling scheme during cheese ripening. Three cylinders each were cut out of the semi-hard cheeses (Tilsit-type) after 45 and 90 days and additionally after 180 days out of the hard-cheeses (Gruyere-type). Each time, the rind of one of the cylinders was removed to obtain a sample corresponding to the edible part of the cheese. The two remaining cylinders were cut into zonal samples (rind, border and core zone) as illustrated.
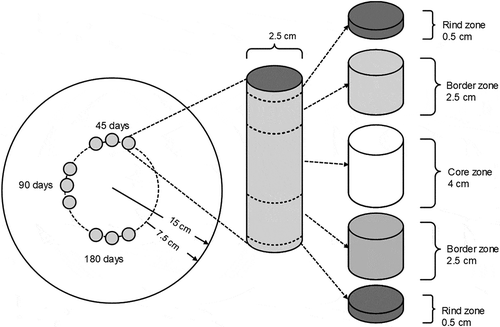
Table 1. Composition of the experimental cheeses at the end of ripening.
Figure 2. Iodide and chloride concentrations in the rind, border and core zones of Tilsit-type semi-hard cheeses after ripening times of 45 (white) and 90 (grey) days. Half of the four cheeses were treated with non-iodised salt (a, b), the other half with iodised salt (c, d). The figures e and f show the concentrations of iodide and chloride in the aqueous phase of the cheeses treated with iodised salt. The numbers in the graph represent mean values of duplicate samples.
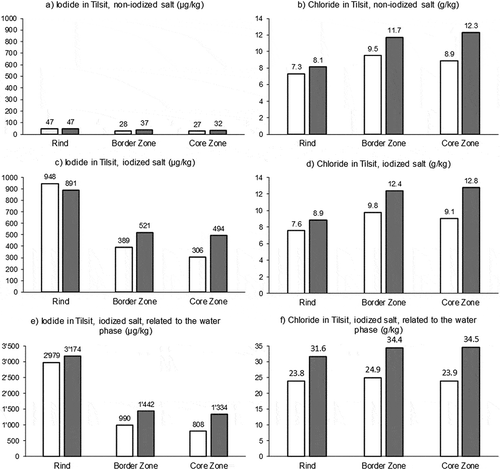
Figure 3. Iodide and chloride concentrations in the rind, border and core zones of Gruyère-type hard cheeses after ripening times of 45 (white), 90 (grey) and 180 (black) days. Half of the four cheeses were treated with non-iodised salt (a, b), the other half with iodised salt (c, d). The figures e and f show the concentrations of iodide and chloride in the aqueous phase of the cheeses treated with iodised salt. The numbers in the graph represent mean values of duplicate samples.
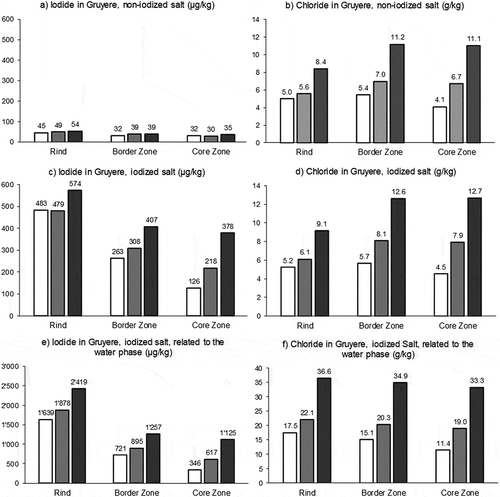
Table 2. Apparent diffusion coefficients (Dapp) for iodide and chloride in semi-hard and hard cheese at ripening temperature (14–15°C), derived from the edible parts (without rind).
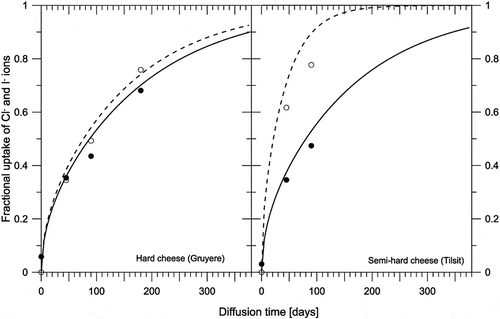
Figure 4. Relative iodide and chloride uptake in function of diffusion time (Mt/M∞) in semi-hard and hard cheese. The black and white dots represent experimental uptakes of iodide and chloride, respectively. The continuous and dashed line represent the calculated profiles for iodide and chloride, respectively, as calculated according to Equation (2).