
Figures & data
Table 1. Transitions and compound specific parameters like cone voltage, collision energy (CE), declustering potential (DP), entrance potential (EP) and collision cell exit potential (CXP) for LC-MS analysis on both the Micromass Quattro Ultima Pt as the Qtrap-6500.
Figure 1. Detected residues of SCP, DC and ERF in egg (dark green) and egg shells (light green) of animals treated during day 1 – day 5. Vertical lines indicate the standard deviation of the concentrations found in the two samples taken (biological variation).
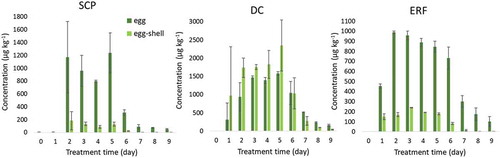
Figure 2. Detected concentration SCP (yellow), DC (black) and ERF (blue) in broiler droppings (to scale).
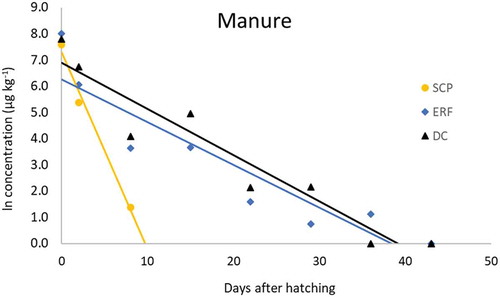
Table 2. Detected (freely extractable) concentration of SCP, DC and ERF in tail and wing feathers of broilers of the 3 respective antibiotic treatments at 4, 5 and 6 weeks of age. All signals below 2.0 µg kg−1 were marked as not detected (nd) based on validation results. For doxycycline only 1 sample was taken at week 5, as not enough broilers were available.
Table 3. Comparison of freely and not-freely extractable residues in feathers.