Figures & data
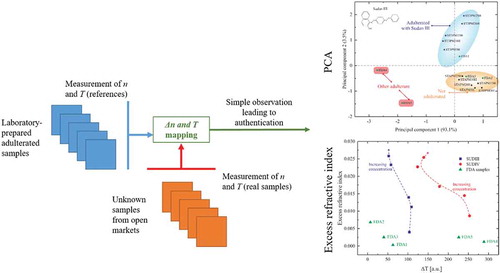
Figure 1. Administrative map of Ghana and its sixteen different regions. The indicated coloured regions represent the ones where the samples were collected.
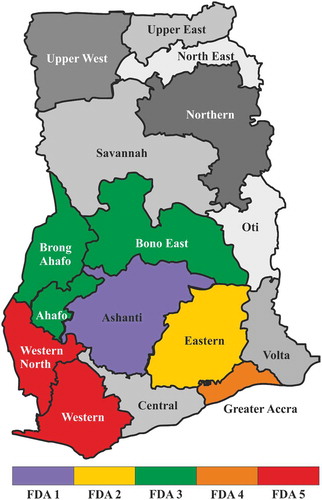
Figure 2. Refractive index first analysis of Ghanaian palm oil samples. (a) Distribution of the refractive index for the samples collected in the indicated regions of Ghana. The grey dots represent the average refractive index of each set and the black dashed line is the refractive index of standard palm oil referred as STDPO. (b) Refractive index of the prepared adulterated palm oil samples by spiking Sudan dyes solution in STDPO (ST3POi in blue and ST4POi in red). All measurements have been done with an Abbe refractometer at λ = 589 nm. The green dashed lines represent the average refractive indices for FDA sample sets. The black dashed line is the refractive index of standard palm oil referred as STDPO. The grey-shaded area corresponds to refractive index of the STDPO, ) where σ is the standard deviation of the measurement.
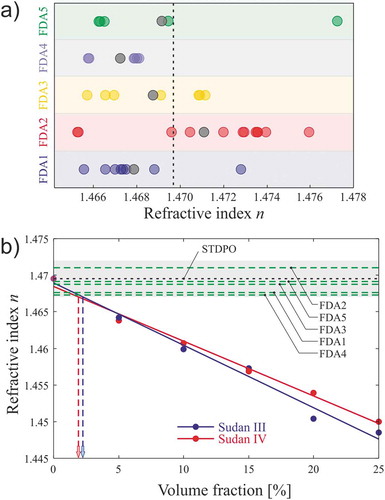
Figure 3. VIS-NIR transmission spectra of the standard palm oil (STDPO, black curve), the Sudan III and Sudan IV dyes in solution in acetone (SUDIII and SUDIV, respectively, purple and yellow curves), acetone (green curve), one of the prepared adulterated samples with SUDIII (ST3PO20, red curve) and with SUDIV (ST4PO20, blue curve), as examples. The shaded grey zone represents the wavelength range used for the PCA and difference of transmission.
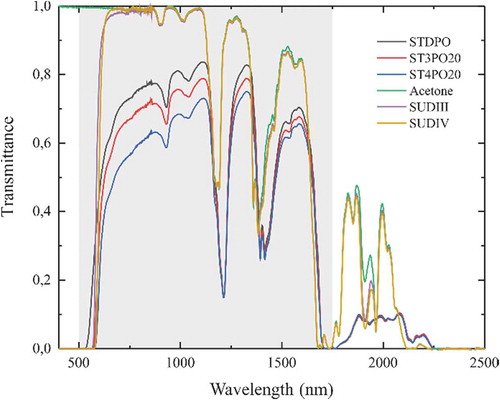
Figure 4. Analysis of the excess refractive index. All values are compared to the reference sample STDPO. The dashed lines are the values for FDA samples. Results are presented for the samples before and after heat treatment with both adulterant solutions: SUDIII picked samples before and after heat treatment in black and red, respectively. SUDIII picked samples before and after heat treatment in blue and green, respectively.
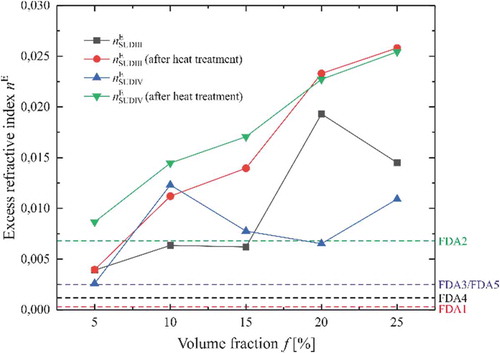
Figure 5. Analysis of the difference of transmission for SUDIII (blue bars) and SUDIV (red bars) adulterated samples. FDA samples are shown with green bars. Standard palm oil with acetone only at different volume is shown in orange. By monitoring the amplitude of the bars and comparing to the reference samples, one can estimate what is the adulterant.
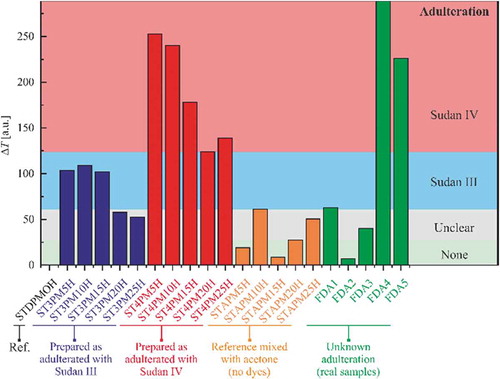
Figure 6. Principal component analysis. PCA scores plots of authentic palm oil and the different preparation with SUDIII (ST3PMiH), SUDIV (ST4PMiH), and acetone (STAPMiH), and the FDA palm oil samples: (a) adulteration with Sudan III and (b) adulteration with Sudan IV. Insets are the skeletal formula of the Sudan dyes.
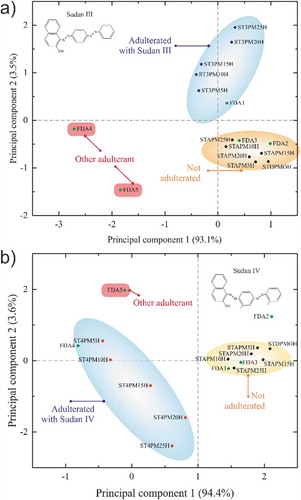
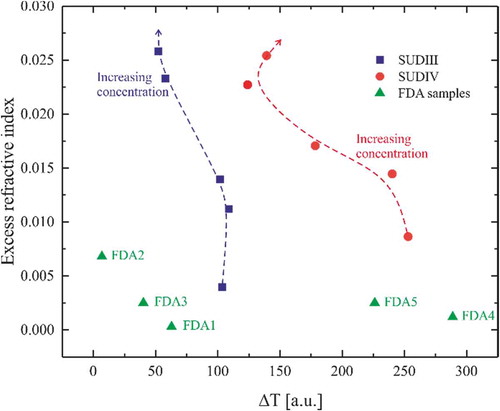
Figure 7. nE-ΔT map. Graphical representation of the excess refractive index and difference of transmission. In green are the FDA samples collected from the market in Ghana. In blue are the prepared solutions adulterated with SUDIII. In red are the prepared solutions adulterated with SUDIV.