Figures & data
Figure 1. Migrating amount in mg/kg food repeated use at 30°C for 0.1 hour 1000 times
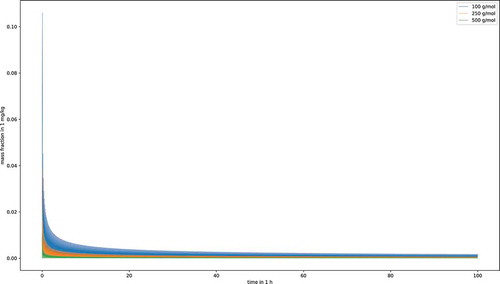
Figure 2. Plot of logarithm of R-criterion against migrating amount in mg/kg food for rubber case
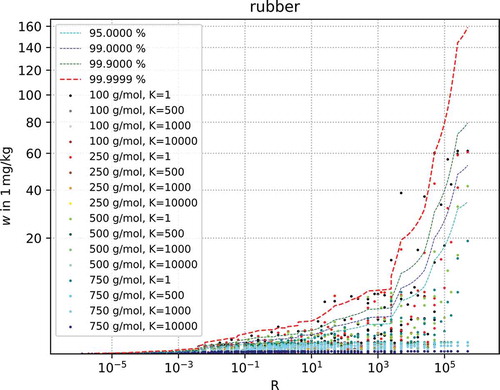
Figure 3. Plot of logarithm of R-criterion against migrating amount in mg/kg food for PP.homo case
Figure 4. Plot of logarithm of R-criterion against migrating amount in mg/kg food for PP.homo case
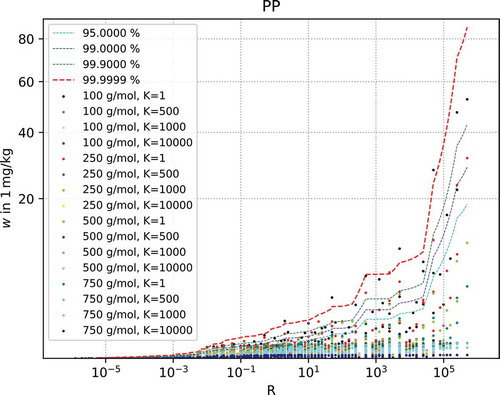
Figure 5. Plot of logarithm of R-criterion against migrating amount in mg/kg food for PA6 case
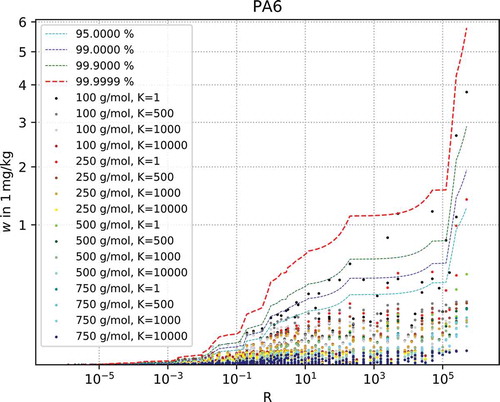
Figure 6. Plot of logarithm of R-criterion against migrating amount in mg/kg food for PET case
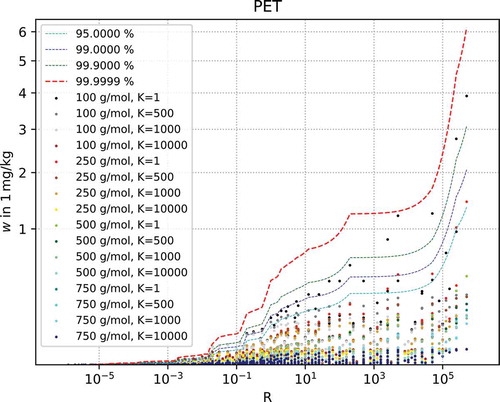
Figure 7. Plot of logarithm of R-criterion against migrating amount in mg/kg food for PS case
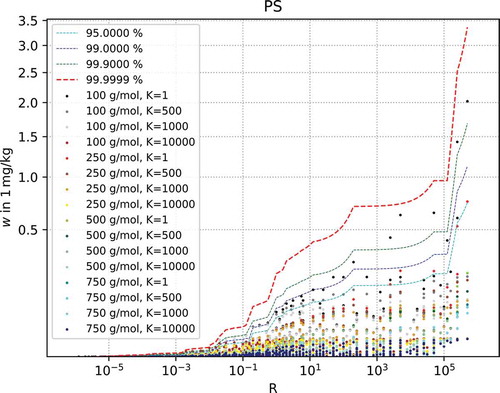
Figure 8. Analytical solution of diffusion equation for a monolayer material
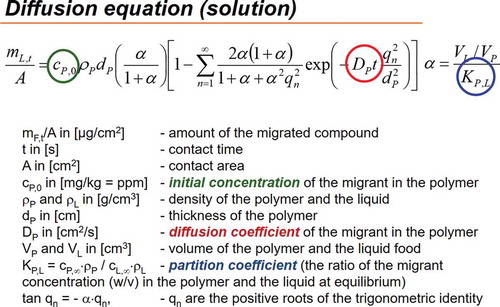
Figure 9. Migration of Irganox 1076 in ethanol 95% (K = 1). Experimental values as dots and migration simulation as blue curve
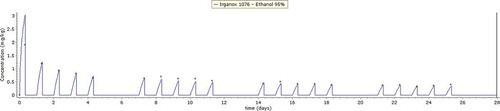
Table 1. Summary (first 30 rows from 962) of calculation for migrant with molecular mass of 100 g/mol (migration amount > 0.09 mg/kg food marked in red) for rubber
Table 2. Repeated use scenario
Table 3. Migration of Irganox 1076 in ethanol 95% (repeated use time/temperature scenario)
Table 4. R+-criterion for plastics below which no migration testing may be required depending on the Cramer Class of the migrant
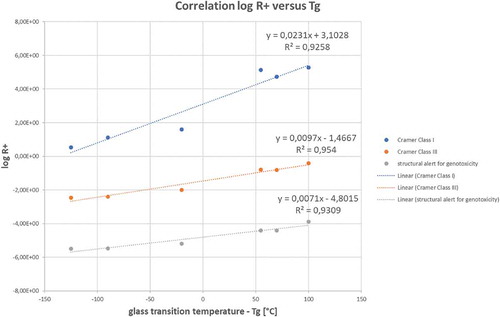
Figure 10. Correlation of log R+-criterion versus glass transition temperature (Tg) of the polymer