Figures & data
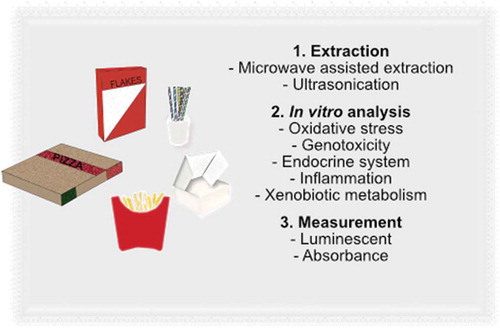
Table 1. Food packaging materials (FCMs) tested
Table 2. Summary of bioassays and respective endpoints
Figure 1. Oxidative stress response in MCF7 AREc32 cells exposed to FCM extracts for 24 h (a, b). The graphs represent mean ± SD of quadruplicates (n = 4) from one representative experiment, and the dotted line is the induction ratio 1.7 fold change, which was defined as the cut-off for bioactivity. The hashed grey black bars represent concentrations that were cytotoxic
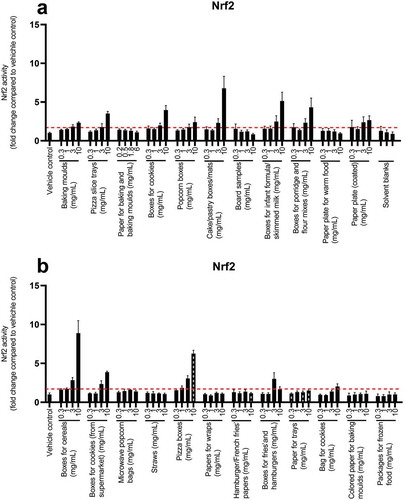
Figure 2. Micronuclei formation in TK6 cells after exposure to FCM extracts for 24 h (a) and cytotoxicity test (b) Mitomycin C (MMC) was used as a positive control at concentrations 100 and 200 nM (a,b). The graphs illustrate mean ± SD of quadruplicates (n = 4) from one representative experiment. The dotted line in graph B represent the cut-off limit determined by the manufacturer’s protocol. Data was analysed using one-way ANOVA, followed by Dunnett’s post-hoc test. Results that were statistical significant are indicated by asterisks (* p-value < 0.05, *** p-value < 0.001, **** p-value < 0.0001)
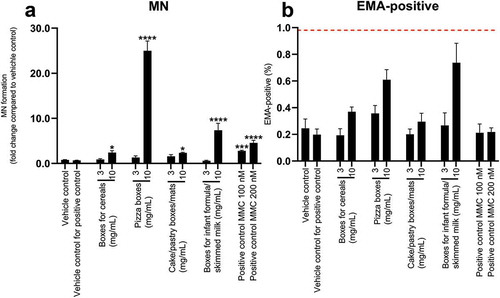
Figure 3. Antioestrogenic effects in VM7Luc4E2 cells after 24 h of exposure to FCM extracts (a,b) The graphs illustrate mean ± SD of quadruplicates (n = 4) from one representative experiment. Unspiked medium with MeOH/MQ water was used as a control for the assay (1%). The dotted line shows the cut-off limit of 0.7. Samples with an activity below the cut-off were defined as bioactive. The hashed grey black bars represent concentrations that were cytotoxic
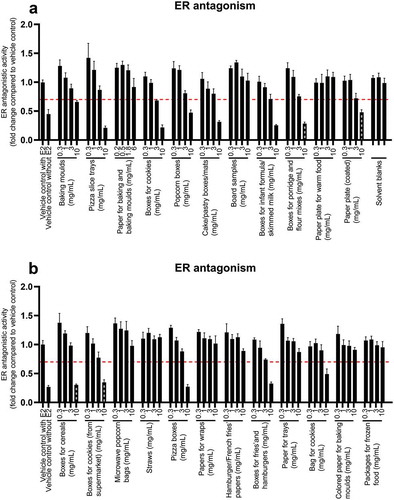
Figure 4. Antiandrogenic response in AR-EcoScreen GR-KO M1 cells after 24 h of exposure to FCM extracts (a,b). Unspiked medium with MeOH/MQ water was used as the control for the assay (1%). The panel shows mean ± SD of quadruplicates (n = 4) from one representative experiment. The dotted line illustrates the cut-off of 0.7. Samples with an activity below the cut-off was defined as bioactive
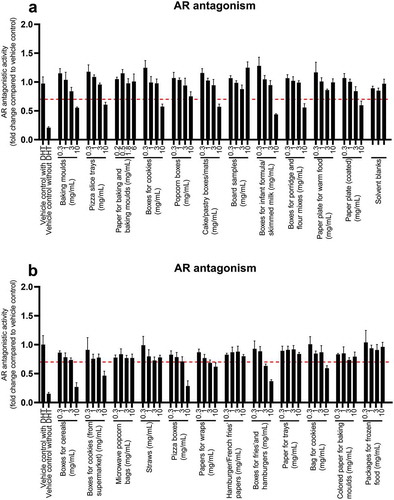
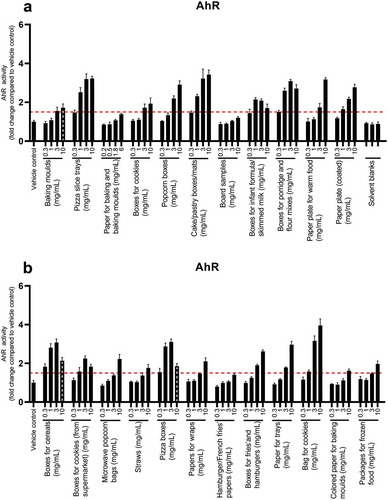
Figure 5. AhR activity in DR-EcoScreen cells after 24 h of exposure to FCM extracts (a,b). The graphs illustrates mean ± SD of quadruplicates (n = 4) from one representative experiment. The dotted line shows the cut-off limit of 1.5. The hashed grey black bars represent concentrations that were cytotoxic