Figures & data
Table 1. Overview on all applied extraction techniques and conditions for tea herbs. Additionally, capped vessels were shaken horizontally at 250 rpm
Table 2. List of analysed substances. A capitalised O in the name of PA depicts its N-oxide and putative trivial names are given in brackets. The retention time (rt) of the analyte is given, identification is based on reference substance (ref) or literature (1 = (Boppré et al. Citation2005), 2 = (Kaltner et al. Citation2019), 3 = (van de Schans et al. Citation2017), 4 = (Cheng et al. Citation2017), 5 = (Colegate et al. Citation2012)) and analytes were found in iced tea beverages (b) and/or tea herbs (h)
Table 3. Transfer rate of every extraction step (extr) for ISO (top) and vendor’s (bottom) infusion preparation. Values are given in (%) and for overview purposes, their corresponding standard deviations have been omitted. These are derivable from the table S10 (median RSD 12%), from which the transfer rates have been calculated
Table 4. Sample properties and transfer rates for the ten teas and herbal teas investigated. For transfer rate range (TR) and number of found PA (n) considerations, unkn, SK and TDiso1 & 2 have been assigned to PAFB and RTOiso, unknO and TDOiso1 & 2 to PANO. The composition information refers to vendor’s indication and have not been verified. 1) thyme (30%), elderflower (20%), linden blossoms (20%), anise (5%), blackberry leaves (5%), bitter fennel (5%), rose hip peels (5%), wild thyme (5%), liquorice root (5%). 2) sage, peppermint, blackberry leaves, curly mint, liquorice root, apple, honey granules. 3) Senna angustifolia (Vahl) Batka leaves (current botanical name: Senna alexandrina Mill.)
Figure 1. Box plot of the 1st transfer rate (TR1) vs PA groups, sorted by PAFB, SK, PANO and grouped by acidic (1st box), ISO (2nd box) and vendor’s extraction (3rd box)
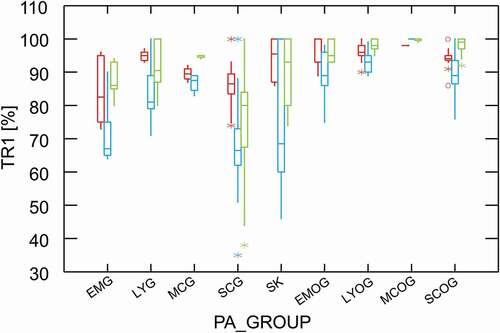
Figure 2. Plot of vendor’s vs ISO transfer rates. The dotted line denotes equal transfer rates, while most ratios lie on the straight offset line, representing the calculated transfer rate difference of 8%. Dots denote PAFB (including SK), crosses PANO. Numbers indicate low abundant PAFB (1), peppermint herb cluster (2), red bush (3), mixed herbal (4) and black teas (5) samples. For details, see text
Figure 3. Total PA-content of iced tea beverages, sorted lowest to highest (n = 46). Letters in sample names denote unknown extract origin (?), alpine herbs (a), black tea (b), fennel (f), green tea (g), herbal tea (h), mixed herbal (m), peppermint (p) and numbers indicate the quantity of PA found. The insert of the Figure displays the PA-content distribution depending on declared origin of extract