
Figures & data
Figure 1. Map of Lake Kariba showing the 5 locations (sites 1–3 and farms 1 and 2) where tilapia was collected on the Zambian side. (Courtesy of Eliezer Brown Mwakalapa 2019).
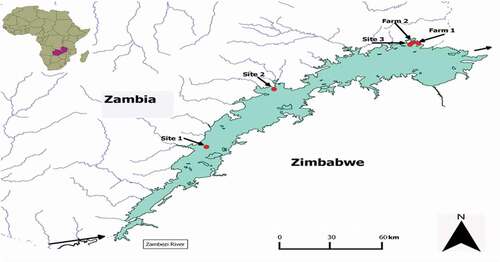
Table 1. Location and fish characteristics: Sampling time, mean and range of individual length and number of pooled muscle samples from farmed (farms 1 and 2) and wild tilapia distant (sites 1 and 2) and near farms (site 3) from Lake Kariba. Zambia
Table 2. Descriptive statistics of heavy metal concentrations in muscles of wild and farmed tilapia (mg/kg ww) and maximum limits (ML) set by WHO/FAO, EU, FDA
Figure 2. Concentration of heavy metals (Cu, Fe, Zn, Ni, Mo, Al and Cd) in muscle tissue of farmed and wild tilapia from Lake Karbia. Site with the same letter (a,b,c,d, or e) showed no significant difference in metal concentration at ** p < .01 and * p < .05.
Table 3. Estimated weekly intake (EWI) of heavy metals and Selenium health benefit values (HBVSe) from consumption of muscle tissue from wild and farmed tilapia from Lake Kariba, Zambia
Table 4. Total hazard quotient (THQ) and hazard index (HI) for analysed heavy metals from consumption of wild and farmed tilapia
Table 5. Estimation of cancer risk (CR) posed by a lifetime of consumption of wild and farmed tilapia from Kariba due to As, Pb, Cd, Cr and Ni
Table 6. Comparison of mean concentration of heavy metals in muscle (mg/kg ww) of wild tilapia from other studies
Table 7. Comparison of mean concentration of heavy metals in muscle (mg/kg ww) of farmed tilapia from other studies