
Figures & data
Table 1. The tested acquisition methods (AMs) using different resolution settings, based on combinations of FS analysis with vDIA, where the number of mass ranges (DIAs) used are shown in brackets or with AIF in combination with DDA
Figure 1. Suspect screening workflow using a suspect list, where the blue sections indicate where specific parameters were varied for data processing; (1) ‘Detect compounds’ that search the FS spectra for mass peaks, (2) ‘Assign compound annotations’ that select data sources of choice for the names showing in the list of found peaks (name, formula and structure), and (3) ‘Search mass lists’ that make the programsearch the suspect lists for masses that match the detected compounds.
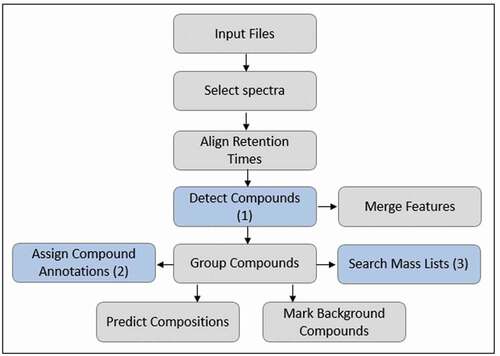
Figure 2. Suspect screening workflow using mzCloudTM, where the addition of the node makes the program search the online mzCloudTM database for matches with the found MS2 spectra.
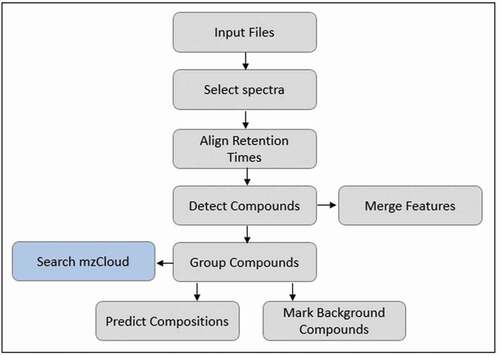
Figure 3. The effect of the mass tolerance (resolution = 140,000) set to 5, 3 or 1.5 ppm (in duplicate (a and b)) on the number of false positives, true positives and false negatives (expressed as a negative number in this bar graph) found in the standard mix solution, fortified animal feed and feather meal using a suspect list with and without retention times (tR). The total number of substances in the standard mix solution is 114.
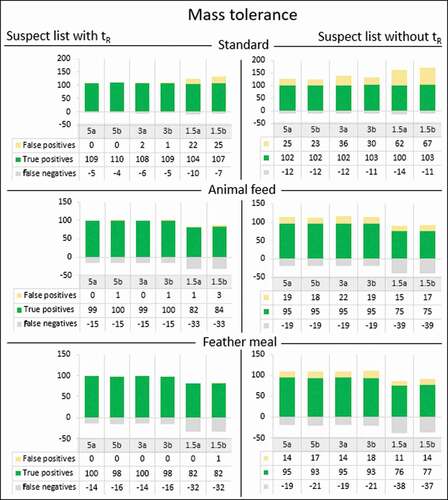
Figure 4. The number of true positives, false negatives and false positives in standard mix solution, fortified animal feed and feather meal matrix based on 6 different acquisition methods using either a suspect list workflow (including retention times (±0.1 min), 5 ppm mass tolerance) or the mzCloudTM database. Using the latter, the number of other mzCloudTM hits was also evaluated.
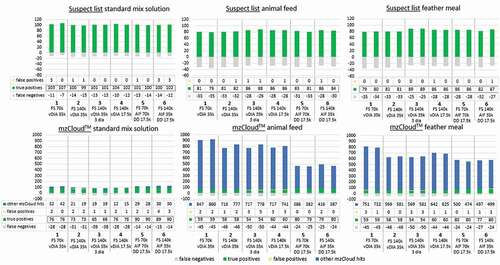
Table 2. Antibiotics found in imported feather meal samples, with determined concentrations (µg kg−1) of confirmed compounds by LC-MS/MS and indications whether the compound had a suspect list hit (a) and/or mzCloudTM hit (b) in suspect screening. Found compounds that were not in the scope of the LC-MS/MS analysis but were confirmed according to 2002/657/EC are indicated with an ‘x’