Figures & data
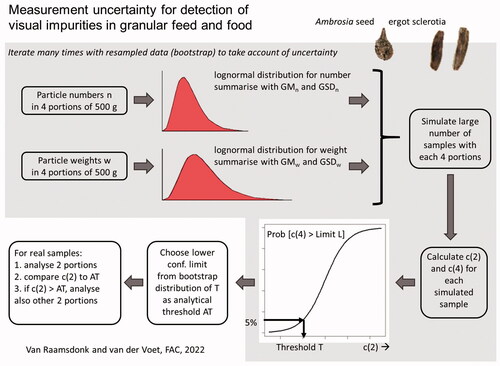
Figure 1. Images of targeted undesirable substances. Left: Ambrosia artemisiifolia seed surrounded with matrix material, collection of A. artemisiifolia seeds. Right: ergot sclerotia showing size diversity (top) with matrix kernels (rye seeds; bottom). Size bars 5 mm.
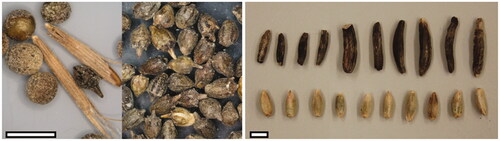
Figure 2. Flow chart of the monitoring procedure to establish the correct contamination level of units of undesirable substances in feeds of whole kernels.
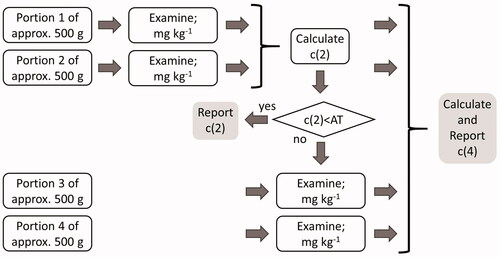
Table 1. Geometric mean (GM) and geometric standard deviation (GSD) to characterise lognormal distributions of particle number (in 500 g) and particle weight estimated from available data sets.
Table 2. Estimated thresholds for screening results (one or two portions).
Table 3. Estimated probabilities of false negative results P(FN) for screening one or two portions and using thresholds that are fixed fractions of the legal limit: T = 0.5 × L or T = 0.67 × L.
Figure 3. Flow chart of the bootstrap analysis to establish the analytical thresholds with a probability of 95% correct compliance.
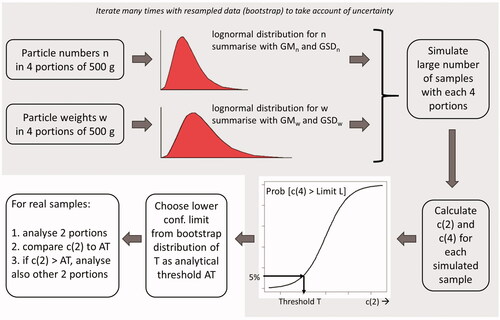
Figure 4. Relative standard deviation in % as a function of correct weight fraction in mg kg−1 for all samples testing positive for Ambrosia.
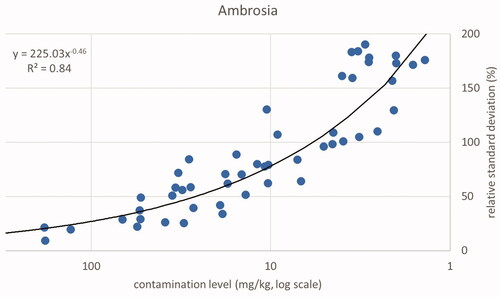
Figure 5. Relative standard deviation in % as a function of correct weight fraction in mg kg−1 for all samples testing positive for Datura.
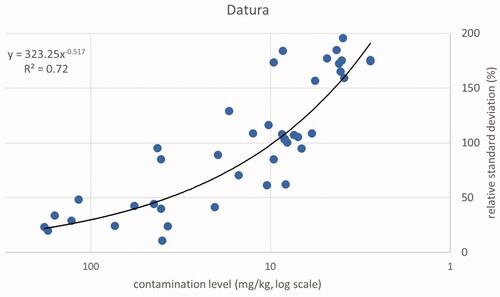
Figure 6. Plot of correct weight fractions in mg kg−1 (x-axis) and relative standard deviations in % (y-axis) for all samples of cereals testing positive for ergot sclerotia (dots). The trend line, its equation and correlation coefficient applies to the set of cereal samples.
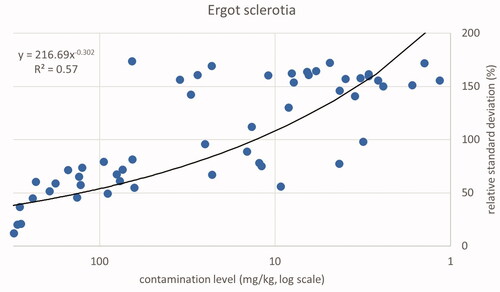
Figure 7. Fitted logistic curves from example simulated datasets for Ambrosia (L = 50 mg kg−1) and ergot (L = 500 mg kg−1). The horizontal dashed lines are at probabilities 0.05 and 0.5. The vertical dashed lines are at the calculated threshold T and at the legal limit L.
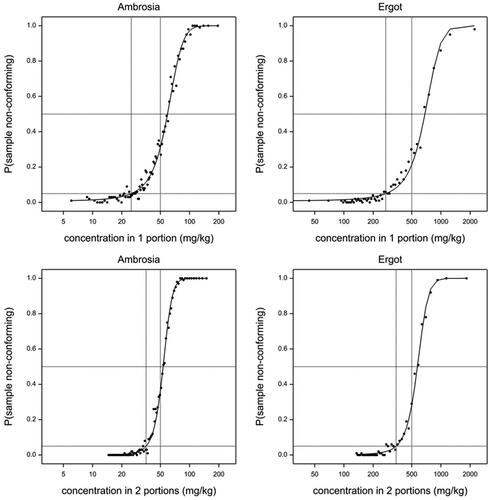
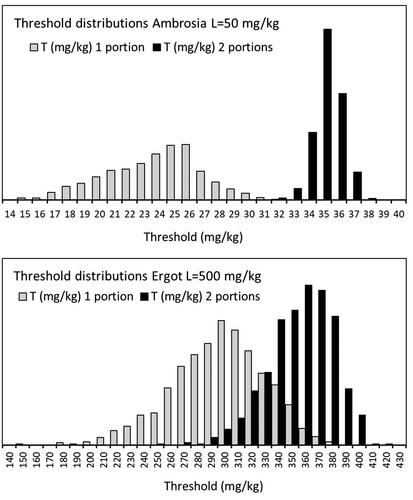
Figure 8. Uncertainty due to number of examined portions is shown in distributions (representing 1000 resampled datasets) of calculated thresholds T for the targets Ambrosia (L = 50 mg kg−1) and ergot (L = 500 mg kg−1) after screening one or two portions. Axis labels indicate maximum T values (in mg kg−1) in each plot.