Figures & data
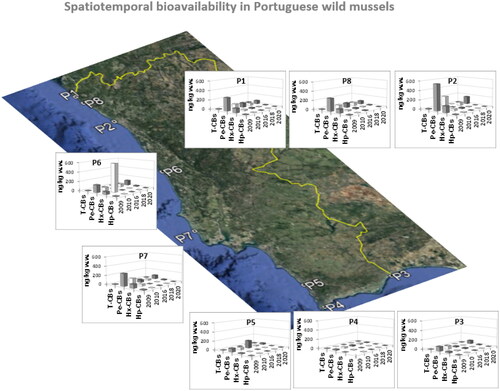
Table 1. Mussels’ sampling sites: location and industrial activities nearby.
Table 2. Spatiotemporal WHO-TEQ bioavailability levels (ng kg−1) of Σ17PCDD/Fs and Σ12PCBs in wild mussels from the Portuguese Atlantic coast.
Figure 1. Spatial trends of PCDD/Fs and PCBs (sum of WHO-TEQ values) in wild mussels collected along the Portuguese Atlantic coast (sampling sites (P1 to P8, described in ).
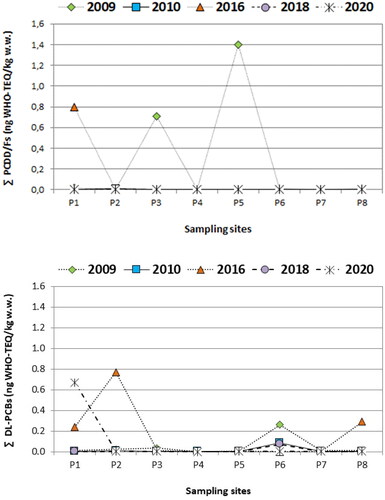
Figure 2. Congener patterns for PCDD/Fs in Portuguese mussels. F1 to F10 are the PCDF congeners and D1 to D7 are the PCDD congeners.
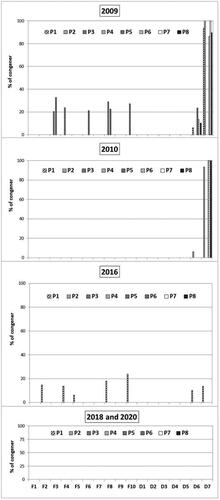
Figure 3. Congener patterns for dl-PCBs in Portuguese mussels.
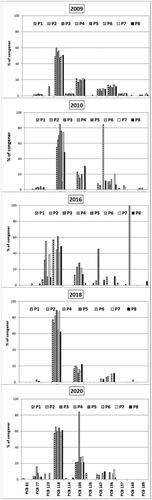
Figure 4. Temporal profiles of dl-PCBs congener isomer classes (tetra-, penta-, hexa- and hepta-PCBs) in all the sampling points (P1 to P8) of mussels.
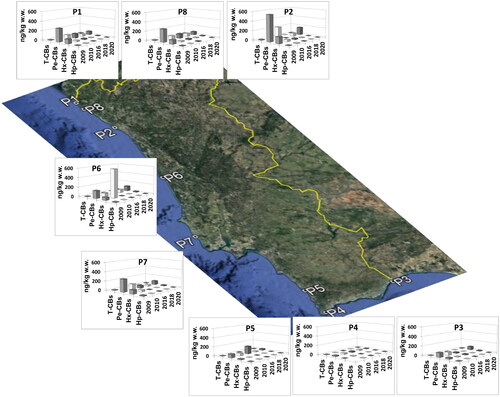
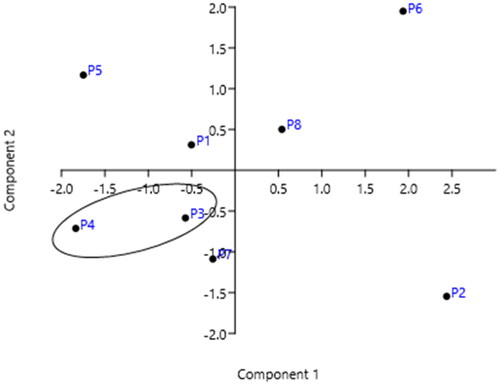
Figure 5. PCA analysis: sum of dl-PCBs by congener isomer classes concentration (ng/kg) versus year of monitoring (data sets in Supplementary Table 1S).
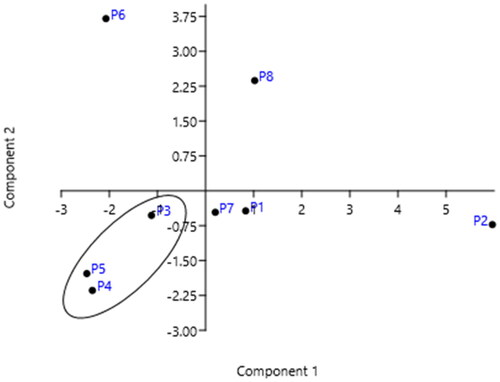
Figure 6. PCA analysis: sum of dl-PCBs concentration (ng/kg) at each sampling station versus year of monitoring (data sets in Supplementary Table 2S).