Figures & data
Figure 1. Structures and acronyms of resorcyclic acid lactones and probable pathways of phase I metabolism (Kennedy et al. Citation1998).
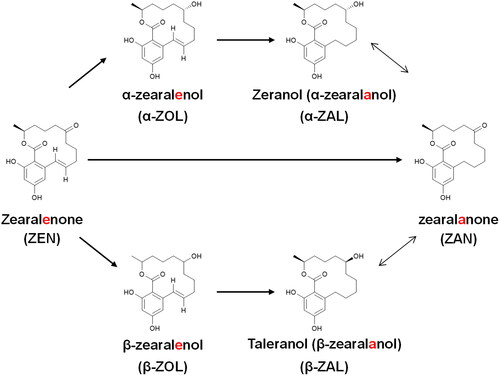
Figure 2. UHPLC–ESI–MS/MS chromatogram corresponding to a standard mixture solution (1 µg L−1) of targeted compounds obtained under optimal gradient elution conditions. (β-ZAL), β-zearalanol m/z 321.3; (β-ZOL), β-zearalenol m/z 319.3; (α-ZAL), α-zearalanol m/z 321.3; (α-ZOL) α-zearalenol m/z 319.3; (ZAN) zearalenone m/z 319.3; (ZEN) zearalenone m/z 317.3.
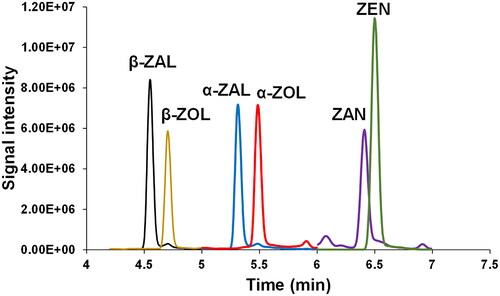
Table 1. Performance characteristics of the developed LC − MS/MS per analyte in porcine urine (n = 7).
Table 2. Feed contaminated by zearalanone (Animal study A): concentrations found in urine (µg L−1).
Table 3. α-Zearalanol administration (Animal study B): concentrations found in urine (µg L−1).
Figure 3. Profile of the six RALs ((β-ZAL), β-zearalanol; (β-ZOL), β-zearalenol; (α-ZAL), α-zearalanol; (α-ZOL) α-zearalenol; (ZAN) zearalenone; (ZEN) zearalenone) determined by UHPLC–MS/MS analysis of the collected urine samples at feed contaminated by zearalenone (Study A). Samples are labelled according to the collection day in the study.
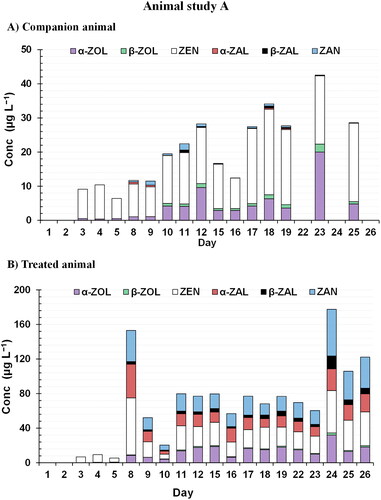
Figure 4. Profile of the six RALs ((β-ZAL), β-zearalanol; (β-ZOL), β-zearalenol; (α-ZAL), α-zearalanol; (α-ZOL) α-zearalenol; (ZAN) zearalenone; (ZEN) zearalenone) determined by UHPLC–MS/MS analysis of the collected urine samples at α-zearalanol administration (Study B). Samples are labelled according to the collection day in the study.
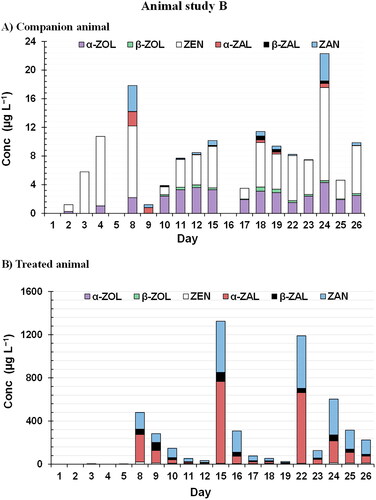
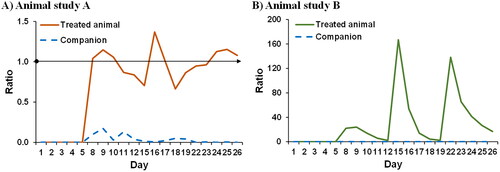
Figure 5. Obtained ratio based on the metabolite pattern of α/β-ZAL + ZAN vs α/β-ZOL + ZEN for (A) Animal study A: Feed contaminated by zearalenone and (B) Animal study B: α-Zearalanol administration. Blue dash lines correspond to the values of control animals while continuous lines to treated animals.