Figures & data
Table 1. Characteristic ions and identification criteria applied to PFOA, L-PFOS, PFNA, L-PFHxS and the respective internal standards (IS) across the validation range of the LC-MS/MS method in food.
Table 3. Summary of compounds with satisfactory and unsatisfactory data obtained during the full validation and the commodity check.
Figure 1. Flowchart of the extraction/clean-up procedure for the analysis of PFAS in food by LC-MS/MS (Group A: infant cereals, baby food, milk and milk-based products; Group B: meat, fish, egg, coffee, fish oil, vegetable oil and fat).
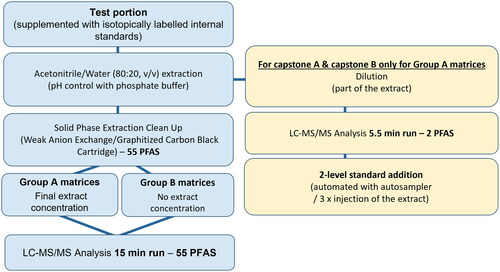
Figure 2. Typical chromatograms of PFOA, L-PFOS and PFHxDA comparing contamination peaks in reagent blank versus signals of either unspiked or spiked samples for both Group A and B matrix representatives (Spiking levels: PFOA and L-PFOS at 0.010 µg/kg in Group A and 0.100 µg/kg in Group B; PFHxDA at 0.050 µg/kg in Group A and 0.500 µg/kg in Group B). Column A refers to blank solvents, column B refers to standard in solvent for Group A and Group B matrices, column C refers to reagent blanks for Group A and Group B matrices, columns D and F refer to unspiked matrices and columns E and G to spiked matrices. Red line corresponds to transition reactions used for analyte confirmation.
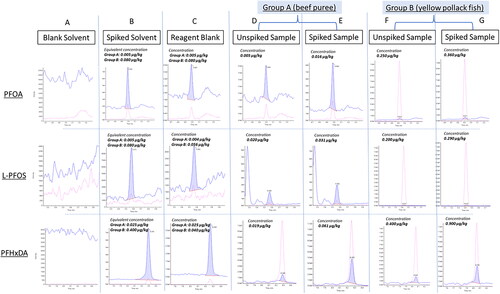
Figure 3. LC-MS/MS method performance at LOQ and 5xLOQ for PFOA, L-PFOS, PFNA and L-PFHxS in food against criteria defined by the EU POPs criteria (EURL Citation2022).
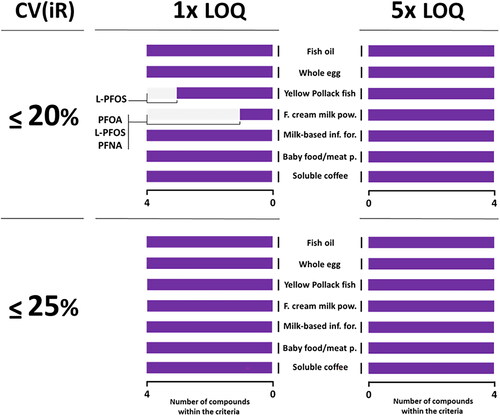
Table 2. Overview of assigned values, obtained z-scores and trueness values for the FAPAS T06107QC fish sample analysed during validation.
Figure 4. LC-MS/MS method performance at LOQ and 5xLOQ for the PFAS (PFOA, L-PFOS, PFNA and L-PFHxS are excluded) in food matrices by LC-MS/MS against criteria defined by the EU POPs criteria (EURL Citation2022).
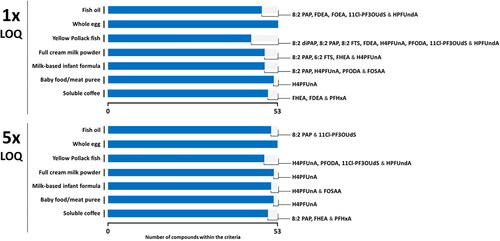
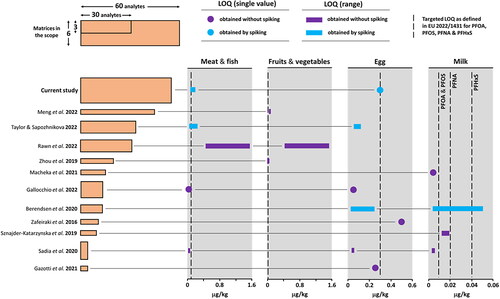
Figure 5. Performance of methods demonstrating the differences in the number of analytes, matrix scope and LOQ for PFOA, PFOS, PFNA and PFHxS.