Figures & data
Table 1. Mean ± standard deviation (n = 3) glyphosate (mg/kg) in whole grain and durum milling fractions from the test materials produced from durum treated with glyphosate-containing herbicide product during the growing season [A: no application of product; B: application at <30% grain moisture content (MC); C: application at >30% MC].
Table 2. Mean ± standard deviation (n = 3) cadmium (mg/kg) in whole grain and durum milling fractions from the test materials representing a high cadmium accumulating variety (A) and a low cadmium accumulating variety (B, C).
Figure 1. Distribution of total cadmium (Cd), glyphosate (GLY), and sample mass in test material (A, B, and C) milling fractions. Percentages represent the mean of three replicate test portions.
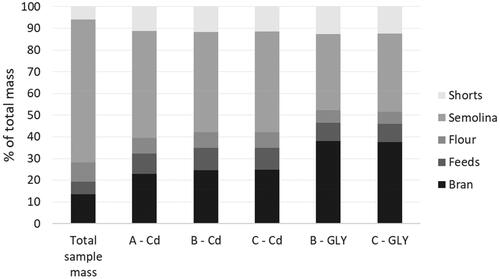
Table 3. Mean ± standard deviation (n = 3) glyphosate in pasta (dry weight) and cooking water sampled at various time points during cooking. Pasta was prepared from test materials B [application of glyphosate-containing herbicide product at <30% grain moisture content (MC)] and C (application at >30% MC). Unique superscripts indicate means were significantly different (one-way ANOVA, p < 0.001).
Table 4. Mean ± standard deviation (n = 3) cadmium in pasta (dry weight) and cooking water sampled at various time points during cooking. Pasta was prepared from test materials representing a high cadmium accumulating variety (A) and a low cadmium accumulating variety (B, C). Unique superscripts indicate means were significantly different (one-way ANOVA, p < 0.001).
Figure 2. Change in glyphosate content of pasta and water during cooking. Bars represent the mean from the analysis of triplicate test portions.
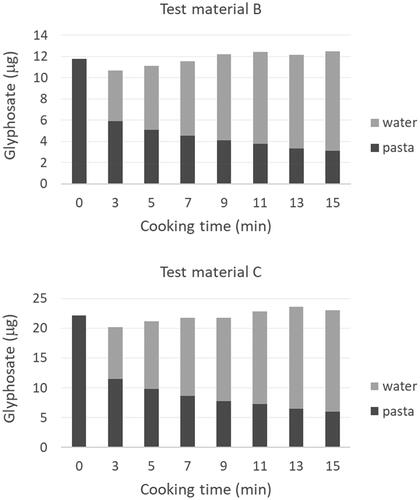
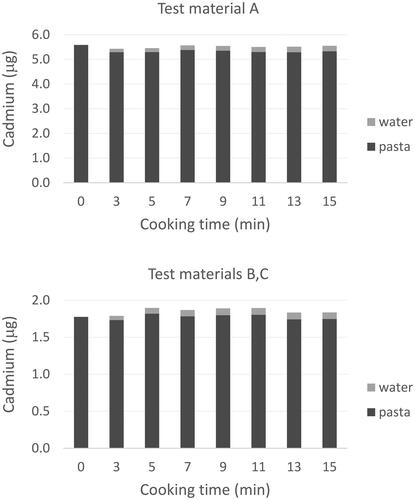
Figure 3. Change in cadmium content of pasta and water during cooking. Bars represent the mean from the analysis of replicate test portions (n = 3 for A and n = 6 for B, C).