
Figures & data
Table 1. Maize discounts for approved THP markets based on FDA recommendations.
Table 2. OTSC survey data for FUM content in the 2017 THP maize harvest.
Figure 1. Decision tree for determining the final disposition of THP maize containing FUM based on blending permissions. ‘P’ represents the probabilities of particular events occurring. aPs for the option to blend. bPs without blending permissions.
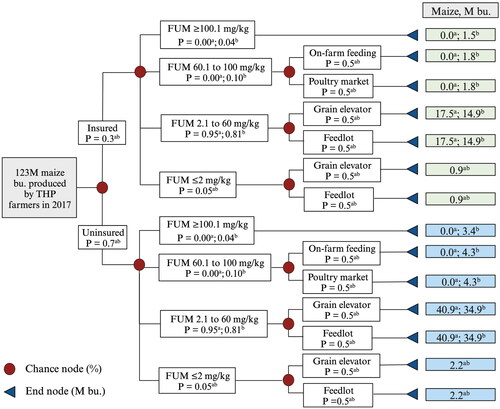
Table 3. Potential economic consequences for THP farmers and the maize industry.
Table 4. Projected financial losses for THP grain elevators.
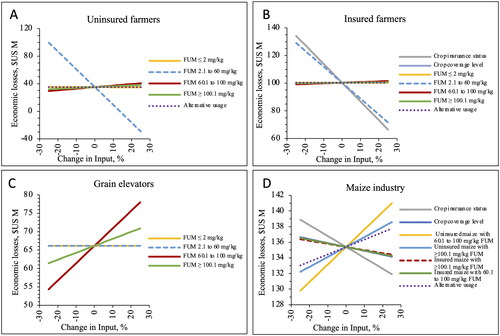
Figure 2. Results for the sensitivity analyses. A (top left): THP uninsured farmers. B (top right): THP insured farmers. C (bottom left): THP grain elevators. D (bottom right): THP maize industry.
Supplemental material