
Figures & data
Figure 1. Selection process for the studies included in the meta-analysis.
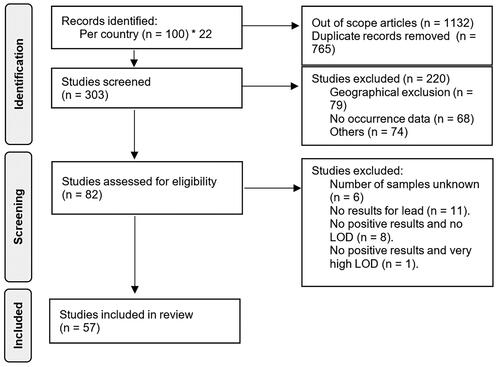
Figure 2. Pooled mean lead concentrations (mg/kg) in honey in the Arab region and per country, when nondetects were assumed to be 0. Abdelghani et al. Citation2019; Abd-Elkader et al. Citation2016; Ahmida et al. Citation2013; Ahmida et al. Citation2021; Al Tufail & Al Araidh Citation2006; Al-Hindi & Shehata Citation2014; Alqarni et al. Citation2014; Arida et al. Citation2012; Ashraf & Akram Citation2008; Badran et al. Citation2023; Bakour et al. Citation2022; Bazeyad et al. Citation2019; Belouali et al. Citation2008; Bereksi-Reguig et al. Citation2020; Bereksi-Reguig et al. Citation2022; Boussaid et al. Citation2018; Chakir et al. Citation2011; Dhahir & Hemed Citation2015; Di Bella et al. Citation2021; Elbagerma et al. Citation2019; Elhakam et al. Citation2021; El-Sofany et al. Citation2018; Ghorab et al. Citation2021; Habib et al. Citation2014; Haderbache et al. Citation2013; Hamad et al. Citation2020; Hassan et al. Citation2010; Hassan et al. Citation2015; Karabagias et al. Citation2017; Karabagias et al. Citation2018; Khuder et al. Citation2010; Laredj et al. Citation2017; Malhat et al. Citation2019; Massous et al. Citation2023; Mehdi et al. Citation2018; Mehdi et al. Citation2023; Mohammed et al. Citation2018; Moujanni et al. Citation2018; Moujanni et al. Citation2017; Nageh et al. Citation2020; Omran et al. Citation2019; Osman et al. Citation2007; Osman et al. Citation2021; Ragab et al. Citation2020; Sherif et al. Citation2019; Tahboub et al. Citation2022; Yaiche Achour & Khali Citation2014; Zergui et al. Citation2023.
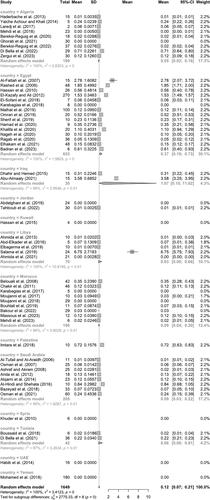
Figure 3. Pooled mean lead concentrations (mg/kg) in honey in the Arab region and per country, when nondetects were assumed to be LOD/LOQ/lowest reported measurement.
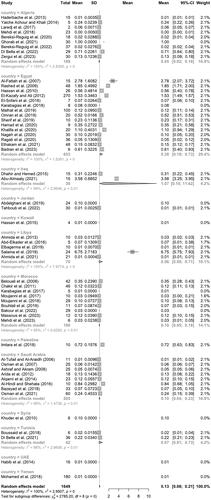
Figure 4. Funnel plot of the mean lead concentration in mg/kg (log scale) in honey in the Arab region, against the standard error of each publication included in the meta-analysis, when non-detects were assumed to be 0. Dashed lines indicate the pooled mean (log scale) and 95% confidence interval.
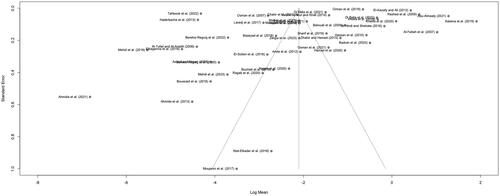
Figure 5. Funnel plot of the mean lead concentration in mg/kg (log scale) in honey in the Arab region, against the standard error of each publication included in the meta-analysis, when non-detects were assumed to be LOD/LOQ/lowest reported measurement. Dashed lines indicate the pooled mean (log scale) and 95% confidence interval.
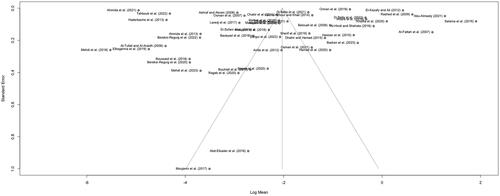
Table 1. Linear regression tests of funnel plots asymmetry (Egger’s test) when non-detects were assumed to be 0 or LOD/LOQ/lowest reported measurement.
Table 2. Margin of exposure (MOE) and estimated daily intake (EDI; in μg per kg of body weight per day) of lead from consumption of honey in the Arab region, based on mean lead concentrations estimated when non-detects were assumed to be LOD, LOQ or the lowest reported measurement of the study.