Figures & data
Figure 1. Chemical structures of TAs, including atropine, scopolamine, anisodamine and homatropine (structures from https://pubchem.ncbi.nlm.nih.gov/ (accessed on 30 September 2023)].
![Figure 1. Chemical structures of TAs, including atropine, scopolamine, anisodamine and homatropine (structures from https://pubchem.ncbi.nlm.nih.gov/ (accessed on 30 September 2023)].](/cms/asset/b108f716-00b9-4cd3-8365-8c31ab02bac0/tfac_a_2339325_f0001_c.jpg)
Figure 2. Extraction procedure for the determination of four TAs in buckwheat samples (created with BioRender.com).
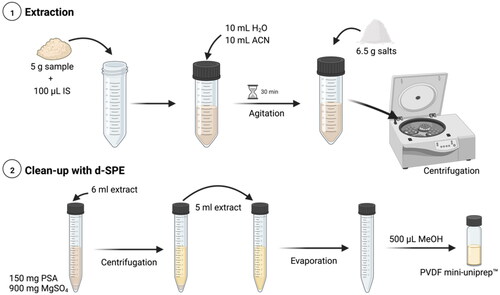
Figure 3. Chromatograms (intensity vs time, min) of atropine, scopolamine, anisodamine and homatropine using different columns, namely, Zorbax Eclipse Plus C18, Acquity UPLC HSS T3 and Acquity UPLC BEH C18.
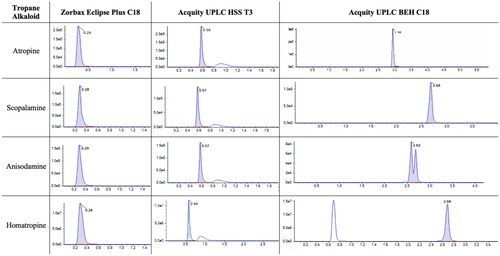
Figure 4. Average peak areas (n = 2) using five different extraction procedures for TAs in buckwheat at the spiked level of (a) 2.5 and (b) 10 µg kg−1, where different conditions are represented by letters. A corresponds to extraction with 10 mL of ACN; B correspond to use 10 mL of cold water, shaking by 1 h and then the addition of 10 mL of ACN; C is the same that B, but without shaking; D corresponds to extraction with 10 mL of ACN and shake time (30 min) and finally, the E corresponds to extraction with 10 mL of water and 10 mL of ACN, followed by 30 min of shaking. The lower-case letters indicate statistically significant differences between the conditions tested, for each TAs.
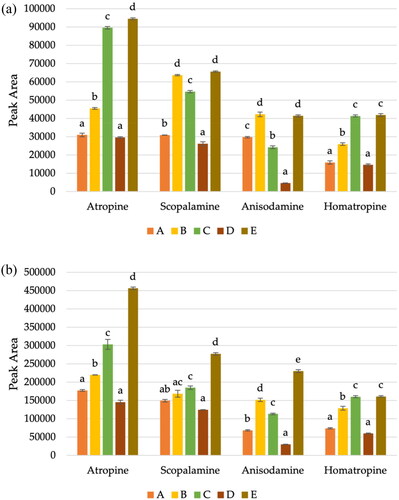
Table 1. Linearity and limits of detection and quantification of UHPLC–ToF-MS method for the simultaneous determination of TAs in buckwheat.
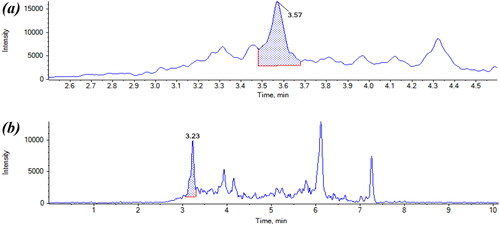
Figure 5. (a) Chromatograms of blank buckwheat sample spiked at LOQ level for each TA, corresponding to 0.625 µg kg−1 for atropine and homatropine and 1.25 µg kg−1 for scopolamine and anisodamine. (b) Chromatograms of blank buckwheat sample spiked at 5 µg kg−1 level for each TA, including atropine, scopolamine, anisodamine and homatropine.
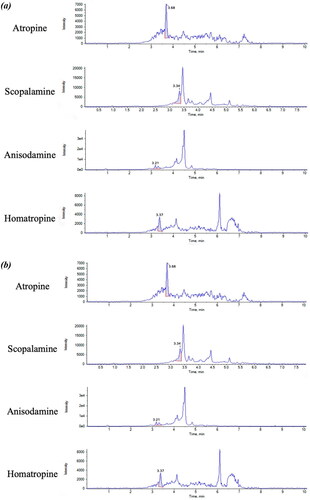
Table 2. Results of the validation for different plant toxins at different spiking levels in buckwheat.
Figure 6. Chromatogram of (a) reagent blank with peak at 2.94 min, also present in the (b) chromatogram.
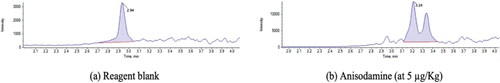
Figure 7. ME of ionisation with the validated analytical method using QuEChERS and d-SPE for the determination of four TAs (atropine, scopolamine, anisodamine and homatropine) at two different levels: LOQ and 10-fold higher that LOQ. The asterisk (*) means a significant difference (p < 0.01) using the Student’s t-test.
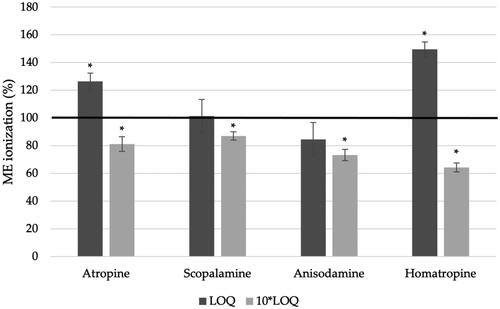
Figure 8. (a) Chromatogram of buckwheat buckwheat-based galette contaminated with atropine and (b) chromatogram of buckwheat flake sample contaminated with homatropine.