
Figures & data
Figure 1 Sandford Meisner teaching acting classes 1950s–1980. Precise dates and photographers unknown. Centre image can be loosely dated to 1950s by presence of young Robert Duvall in first row.

Figure 2 Perspectives on the remote physical workspace from which digital assets are piloted in UnReal.
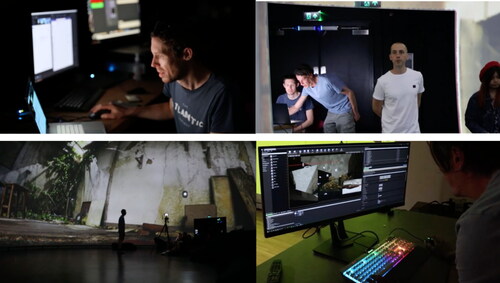
Figure 3 Image: 2030 sea level height marked on a building in Plymouth’s Devonport and Climate Central map of 2030 water levels in Plymouth.
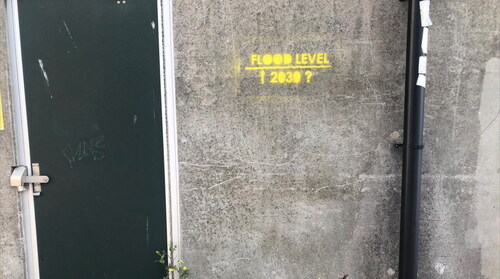
Figure 4 (a and b) Image: 3D model of Union Street & 3D model running in Unreal game engine. Photo: Musaab Garghouti.
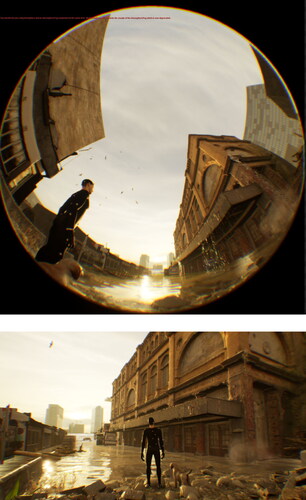
Figure 5 (a and b) Image: John Matthews, Zoe Maramba and Clive Rowe in Market Hall dome, immersed in a perspective-corrected 3D model of Plymouth’s Union Street flooded to projected 2030 sea levels. Architectural schematic of Market Hall dome.
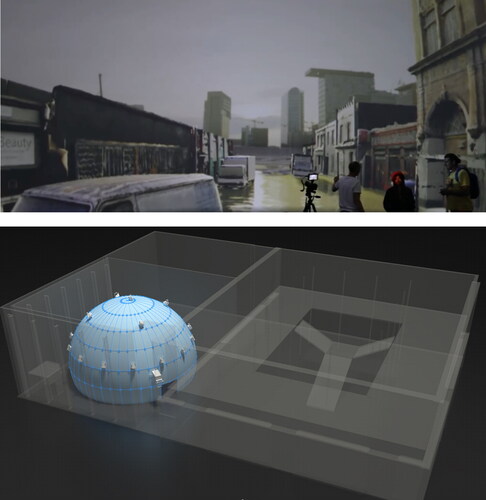
Figure 6 Sequential stills from footage of Zoe Maramba and Clive Rowe practising Meisner Technique in Watercourse experiments (improvisation described above).
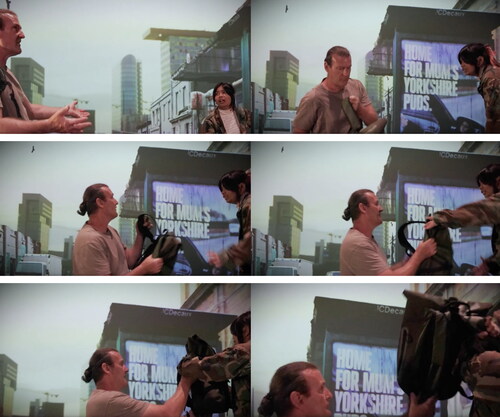
Figure 7 Images show HTC vive tracking experiments in House theatre and Devonport Market Hall Dome.
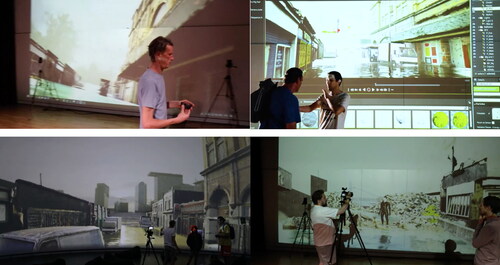
Figure 8 Images shows dome corrected VP playback [left] and participants and project team viewing playback footage together in the physical workspace of the Market Hall dome [right].
![Figure 8 Images shows dome corrected VP playback [left] and participants and project team viewing playback footage together in the physical workspace of the Market Hall dome [right].](/cms/asset/973a0352-7bbe-4f80-95ad-680988e5916f/rtdp_a_2246428_f0008_c.jpg)