Figures & data
Table 1. Dimensional indicators and disadvantage thresholds.
Table 2. Incidence of disadvantages in each dimension and simultaneous disadvantages.
Table 3. Multidimensional housing disadvantages in financial terms (MHDs-f) by different cutoffs of multidimensional disadvantage, the Netherlands 2017.
Figure 1. Comparison of provincial performance rankings, the Netherlands 2017–2018.
Note: the measures of [2] housing inadequacy and [3] dwelling dissatisfaction referred to the data of Netherlands Housing Survey in 2018 (WoON 2018). [1] The proportion of households having insufficient income for accessing adequate housing. This measure used the eligibility threshold of social housing as the socially agreed level of sufficient income for adequate housing in the Dutch context. The threshold of social housing refers to taxable household incomes, which was 36,798 euro in 2017. [2] The proportion of households having one or more problems with room density, drafts, mould and heating. [3] The proportion of households who responded as “very dissatisfied,” “dissatisfied,” or “not satisfied, but not dissatisfied either” with current dwelling (out of the five-level Likert scale).
![Figure 1. Comparison of provincial performance rankings, the Netherlands 2017–2018.Note: the measures of [2] housing inadequacy and [3] dwelling dissatisfaction referred to the data of Netherlands Housing Survey in 2018 (WoON 2018). [1] The proportion of households having insufficient income for accessing adequate housing. This measure used the eligibility threshold of social housing as the socially agreed level of sufficient income for adequate housing in the Dutch context. The threshold of social housing refers to taxable household incomes, which was 36,798 euro in 2017. [2] The proportion of households having one or more problems with room density, drafts, mould and heating. [3] The proportion of households who responded as “very dissatisfied,” “dissatisfied,” or “not satisfied, but not dissatisfied either” with current dwelling (out of the five-level Likert scale).](/cms/asset/fb28a7af-b406-4eb9-93fb-f6fd1a19875b/cjhd_a_2332376_f0001_oc.jpg)
Figure 2. Inequality in the capability for housing: MHDs-f by household type, age groups, and employment type, the Netherlands 2017 (k = 2/3).
Note: The employment types were identified according to the contract types (either permanent contract or temporary basis contract). The temporary basis work includes stand-by-work, temping, and self-employment in this study.
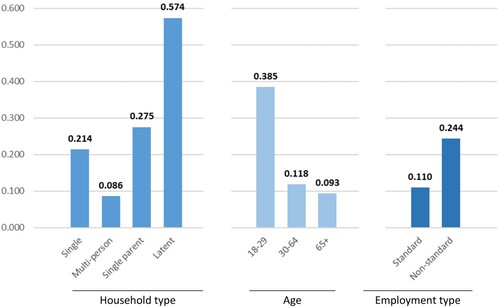
Figure 3. The number of simultaneous housing disadvantages by sub-groups, the Netherlands 2017.
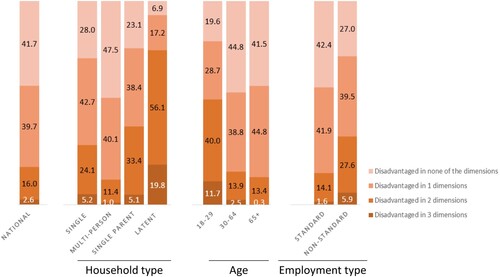
Figure 4. Percentage contribution of each sub-group to the national MHDs-f, the Netherlands 2017 (k = 2/3).
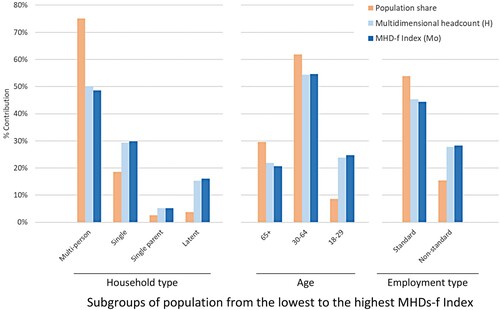
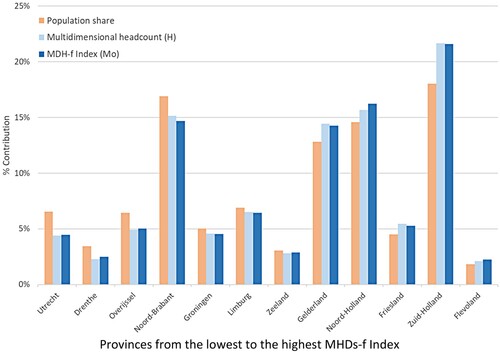
Figure 5. Percentage contribution of each province to the national MHDs-f, the Netherlands 2017 (k = 2/3).