Figures & data
Table 1. Ethiopia’s annual growth rates of GNI per capita based on constant local currency, 2010–2019 (World Bank Citation2021b).
Figure 1. Three sections in charts for evaluating the performance of GNI per capita growth (a)
chart (b) S chart.
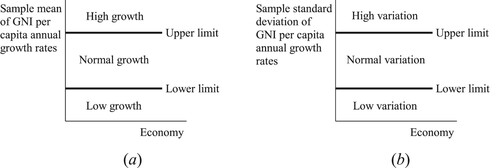
Table 2. List of 217 economies (including 47 LDCs) in the World Bank datasets.
Figure 2. charts: The annual growth rate of GNI per capita, 2010–2019.
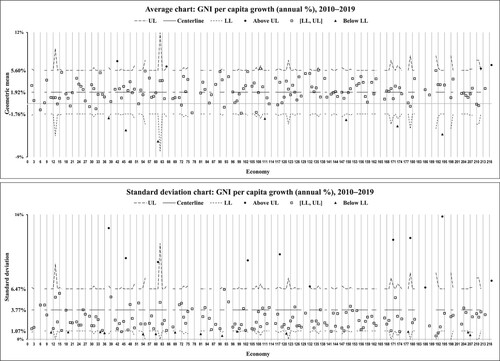
Figure 3. charts: The annual increase in life expectancy at birth, 2010–2019.
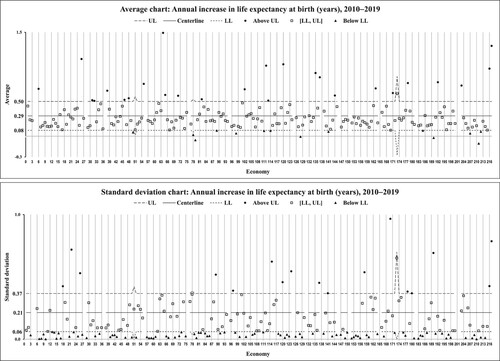
Figure 4. charts: The annual increase in the gross enrollment ratio of tertiary education, 2010–2019.
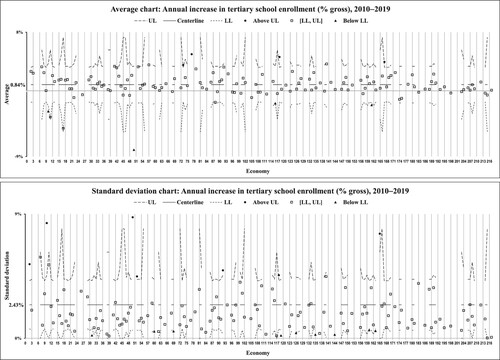
Table 3. Summary of –: Development progress of LDCs in three indicators, 2010–2019.
Table 4. Three growth categories of three development indicators (based on –), 2010–2019.
Table 5. Three variation categories of three development indicators (based on –), 2010–2019.
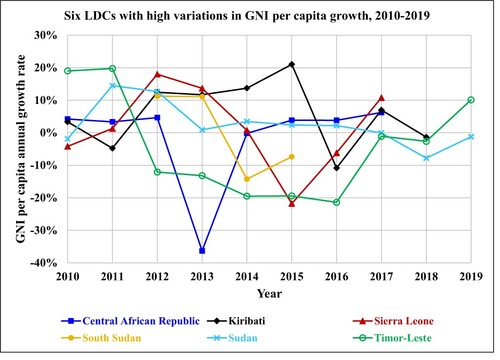
Figure 5. Six LDCs with exceptionally high variations in GNI per capita growth, 2010–2019.