Figures & data
Fig. 1 Viceroyal churches in Juli, Perú.
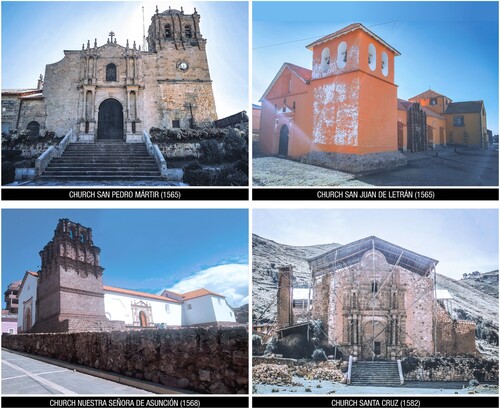
Fig. 2 Flow chart of the methodology phases in the study.
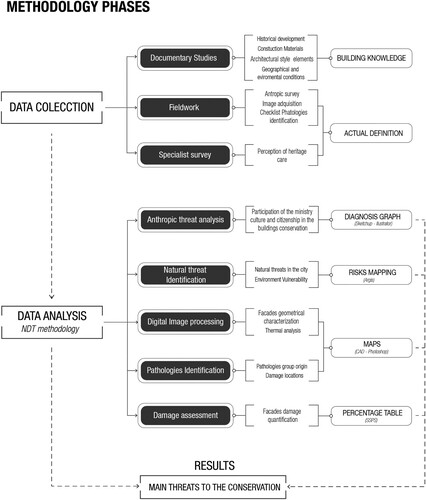
Fig. 3 Location map of the province of Juli in Chucuito with the location of the viceroyal churches. Source: Municipalidad de Juli, 2016.
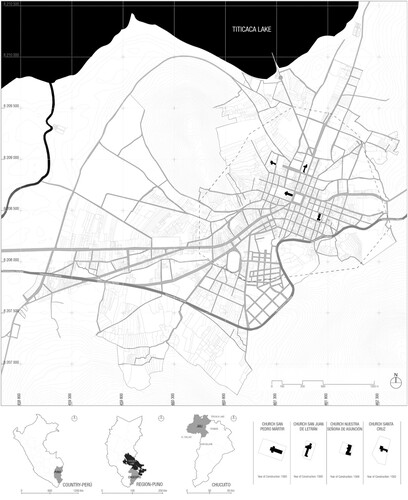
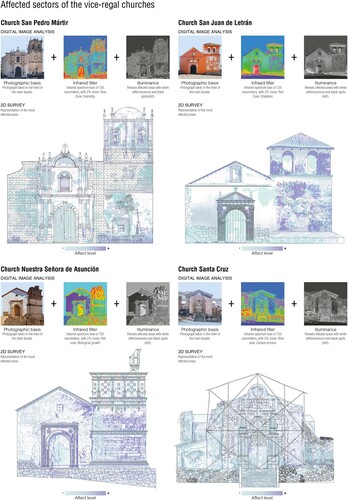
Fig. 4 Photographic set-up for the recognition of style elements in the analysed facades, drawings using CAD.
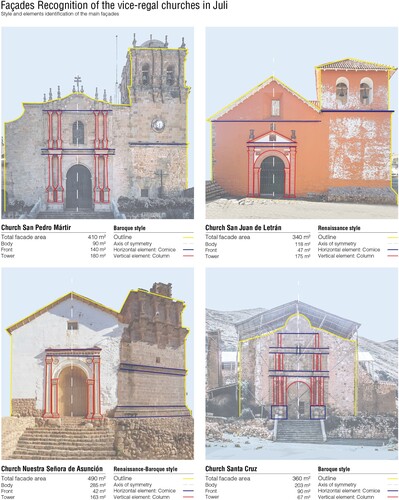
Fig. 5 Church location in context. Overview of the results obtained through the application of the anthropic risk and value perception of the viceroyal churches survey.
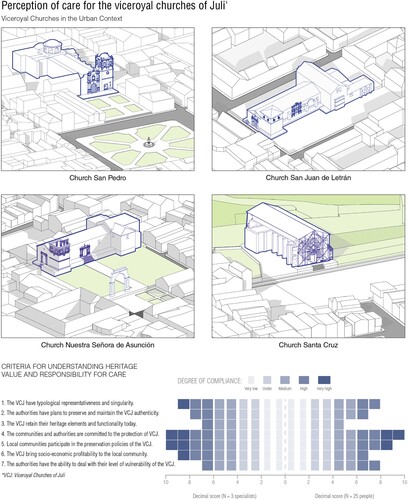
Fig. 6 Risk determination map through the intersection between natural threats and physical vulnerability.
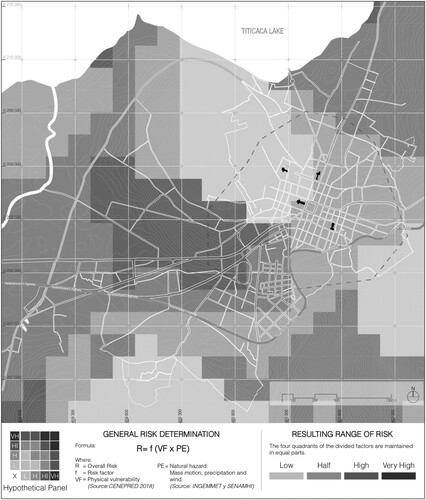
Fig. 7 Detailed damage map and damage identification.
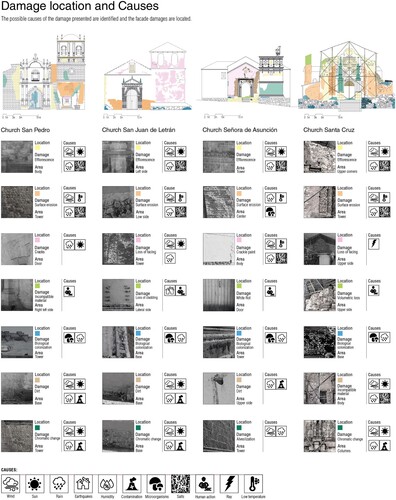
Table 1 Quantification of the main damage pathologies affecting the selected viceroyal church facades.
Fig. 8 Infrared and luminance filtering of the church facades for thermal analysis and degradation mapping.