Figures & data
Figure 1. ADA-based analytical framework (adapted from Dang, Turnhout, and Arts Citation2012).
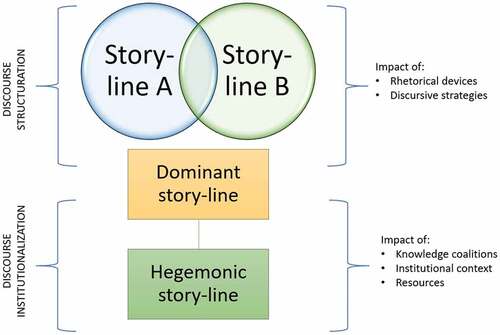
Figure 2. Simplified geological map of the Witwatersrand Basin depicting the location of the primary gold deposits, active gold mines and major towns (Council for Geoscience Citation2017).
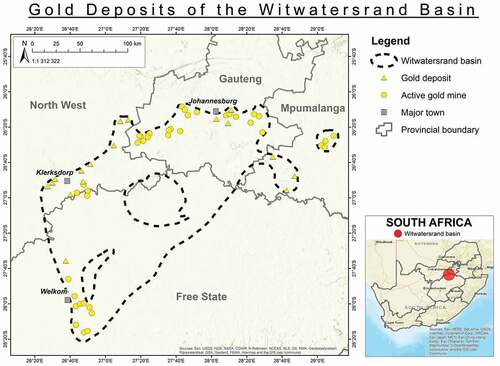
Figure 3. Timeline of events (based on information from Strydom et al. Citation2016).