
Figures & data
Table 1. Distribution of survey instrument to private business.
Table 2. Distribution of survey instruments to professionals and agencies.
Table 3. Building inventory survey distribution.
Figure 1. The Island of Jamaica showing its parishes and capitals (top), regional location (bottom left) and Kingston and the harbour (bottom right). The KMA is the area shaded as Kingston (bottom right), while the Kingston metropolitan region (KMR) includes all of Kingston, Spanish Town and Portmore. Source: Leslie (Citation2010).

Figure 2. The spatial association between the Kingston metropolitan region (KMR), the Kingston metropolitan area (KMA) and the Downtown Kingston central business district (DTK–CBD). Source: Base map from Google Earth and overlay by research
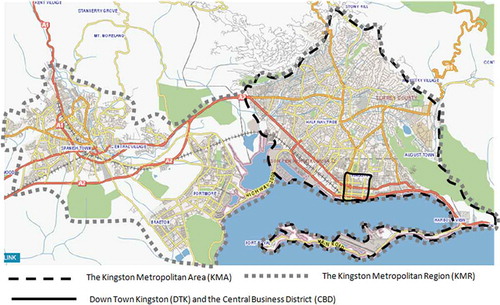
Figure 3. The gridiron plan of Downtown Kingston and the Downtown central business district.
Figure 4. The expansion of the original gridiron (compare and ) of the 1700s to 1897 plan. Source: T. Harrison.
Figure 5. The Kingston CBD gridiron 1702. Source: Clarke Citation2006)
Figure 6. 1991 and 2002 Comparative growth of Kingston metropolitan region. Source: WB (Citation2011).
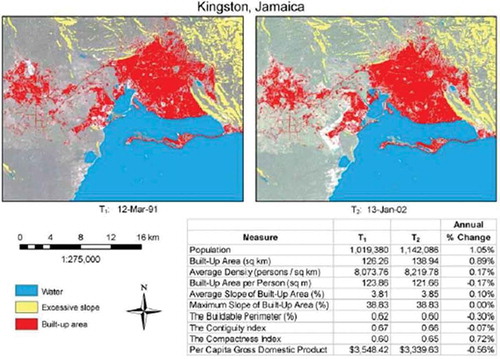
Figure 7. Distribution of population per urban centre (2011 figures). The shape of the parabola adheres to the Rank Size Rule of urban primacy.
Figure 8. The multiple urban nodes of the KMA and DKT-CBD.
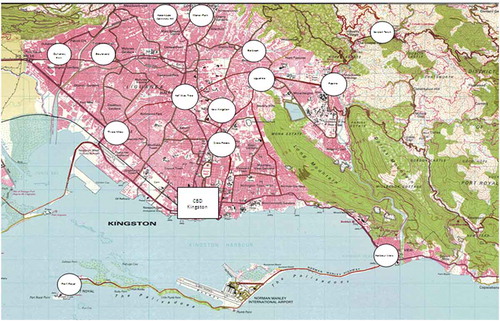
Figure 9. Distribution of the central government grant to regions 2010 to 2013. Source: Ministry of Finance and Planning.
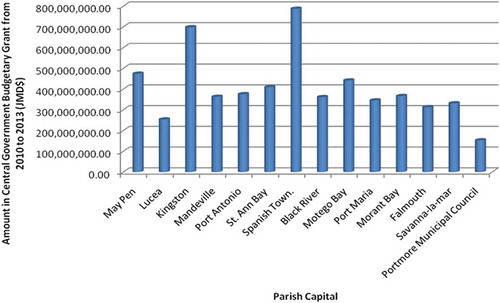
Figure 10. Regional land area supported by each urban centre. Source: STATIN (Citation2012).
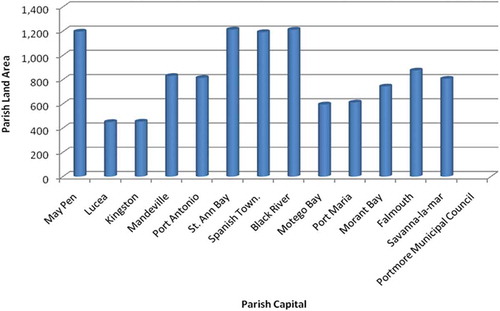
Figure 11. National distribution of squatter settlements and their relationship to natural hazard vulnerability.
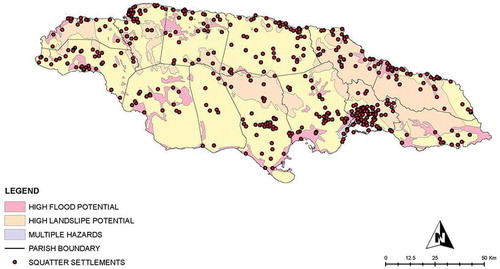
Table 4. Major urban redevelopment efforts in Downtown Kingston.