
Figures & data
Figure 1. GDP per capita in 2014 (R$).
Source: IPEADATA (Citation2014)
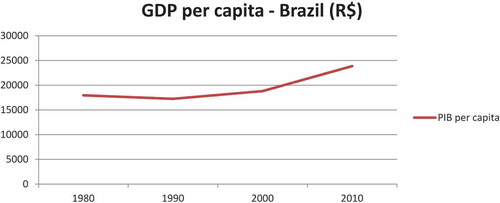
Figure 2. Gini coefficient – Brazil.
Source: IPEADATA (Citation2014) (No data for 1991)
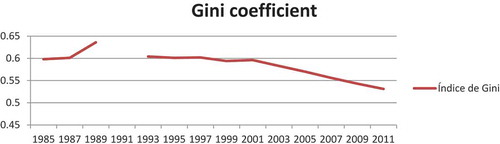
Figure 3. Functional distribution of income – Brazilian GDP.
Source: IPEADATA (Citation2014).
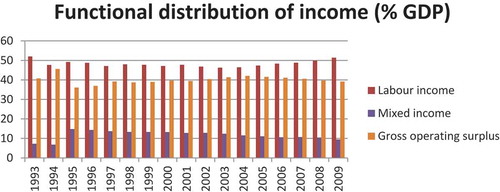
Table 1. Participation of affiliated NGOs in councils, networks and forums.
Figure 4. The ‘Ocupa Cinelândia’, in Rio de Janeiro – 2011.
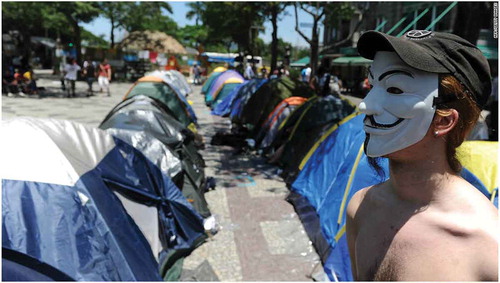
Table 2. Activities developed by the CPCMO-RJ. (CPCMO-RJ, Citation2014).