
Figures & data
Figure 1. Geographical location of Jaipur study area
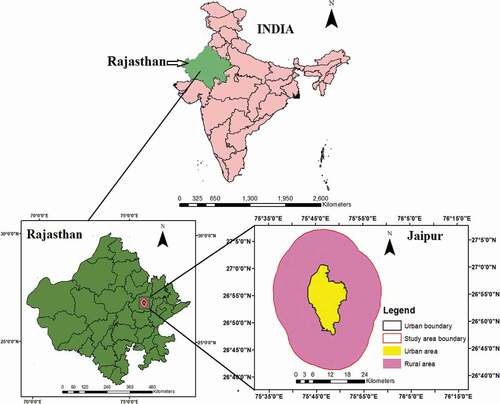
Table 1. Remote sensing data used for the present work
Table 2. Remote sensing data used for LST
Table 3. Classification accuracy assessment report for Jaipur study area
Figure 2. Land use land cover maps of Jaipur study area (a) 2008 (b) 2011
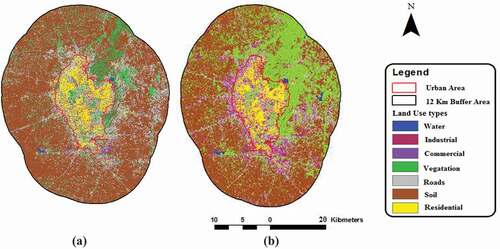
Table 4. Area (km2) of various land covers for different time periods
Figure 3. MODIS LST images of Jaipur study area for the years 2008 and 2011
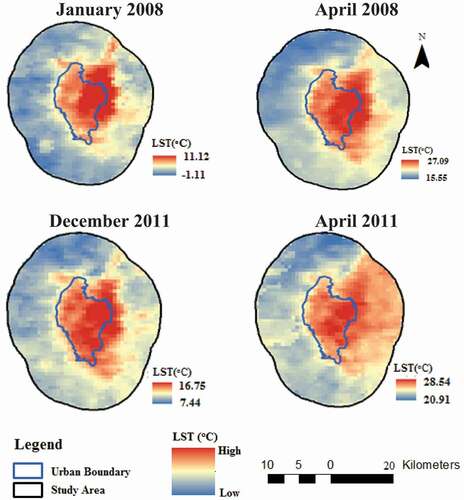
Figure 4. Variation of the mean LSTs and the UHI intensities by classes and seasons (2008)

Figure 5. Variation of the mean LSTs and the UHI intensities by classes and seasons (2011)
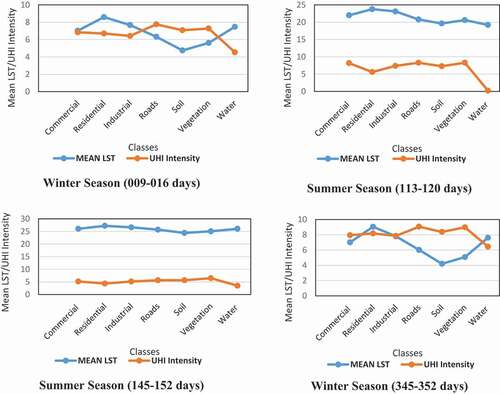
Table 5. Average LST (oC) corresponding to different land use types over Jaipur study area
Figure 6. Variations of mean LST for different LULC type from 2008 to 2011 during summer
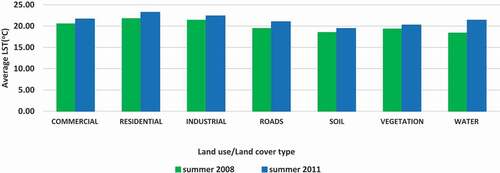
Table 6. Number of pixels of various land cover categories
Figure 7. Variations of mean LST for different LU-LC type from 2008 to 2011 during winter
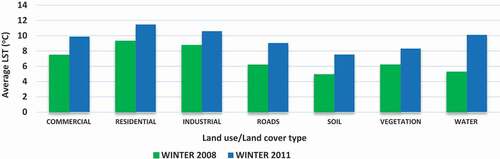
Figure 8. Landsat % ISA images of the study area
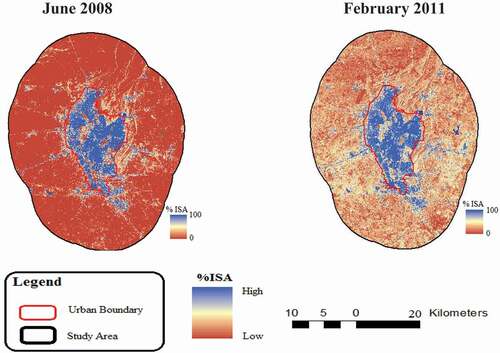
Figure 9. Variations of % ISA over different land cover types
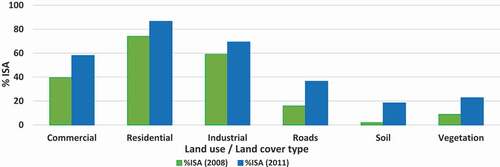
Table 7. % ISA variation over Jaipur study area for different land cover type