
Figures & data
Figure 1. A framework for analysing policymakers’ and taxpayers’ attitudes towards sanitation surcharge (Source: Authors’ construct)
Figure 2. Map of Ghana showing location of Akuapem North and Ga West municipalities (Source: Authors’ construct)
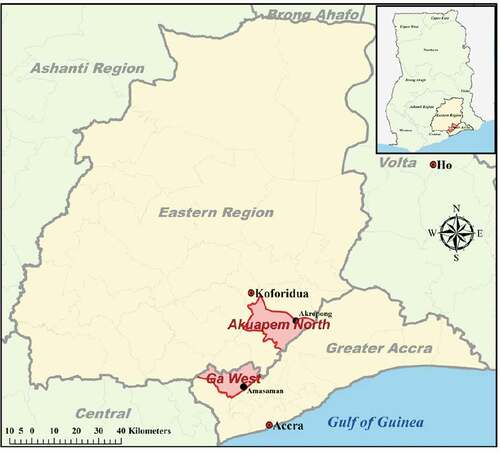
Table 1. Distribution of sample size
Table 2. Socio-economic characteristics of property owners
Table 3. Awareness, willingness and compliance with property rate payment
Table 4. Reasons for non-compliance with property rate payment
Table 5. Willing to pay something extra to improve sanitation by gender
Table 6. Willing to pay something extra to improve sanitation by level of education
Table 7. Willingness to pay something extra to improve sanitation by income class
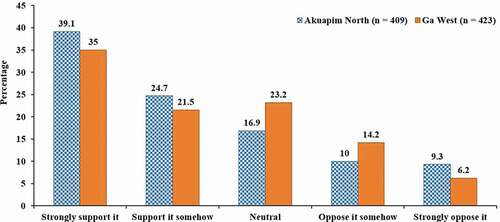
Figure 3. Respondents’ support for pro-poor spending on sanitation (Source: Authors’ construct based on field survey)
Box 1. Reasons why some respondents oppose pro-poor spending on sanitation