Figures & data
Figure 1. Dispersed habitation urban scheme.
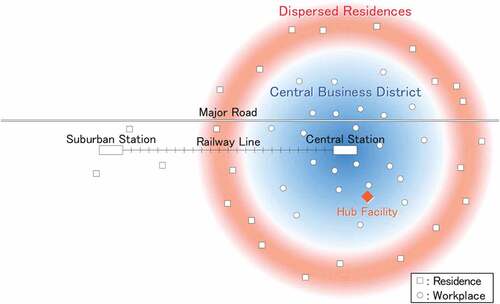
Figure 2. Six types of linked trips.
Figure 3. Process of relocation of household agents.
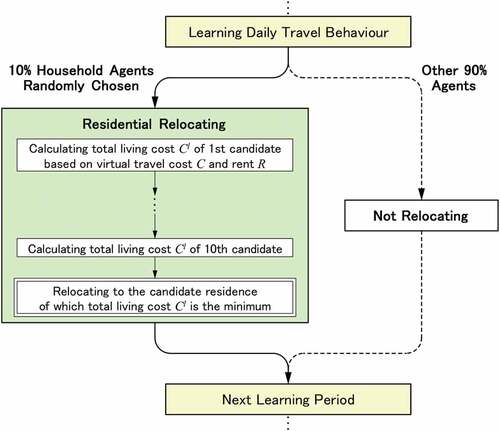
Table 1. Parameter settings based on socio-demographic data and other statistics published by official institutions (Ministry of Land, Infrastructure and Transport Citation2017; MIAC Citation2017) and previous studies (Taniguchi et al. Citation2010; Nagai and Kurahashi Citation2021).
Figure 4. Distribution of residences at the initial state and the start of the simulation.
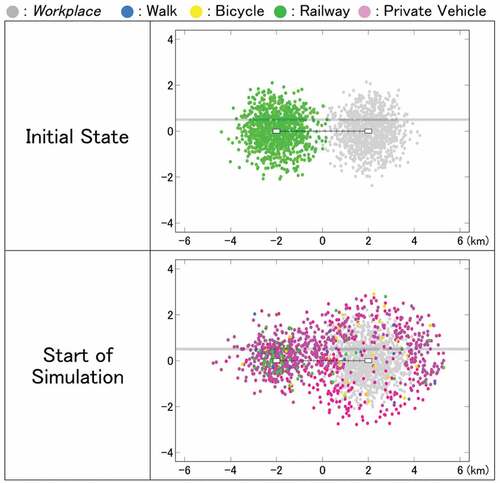
Table 2. Value of each indicator at the initial state and the start of the simulation.
Figure 5. Final distribution of residences in Experiment 1.
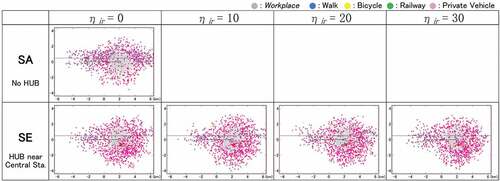
Table 3. Results of each indicator in experiment 1.
Figure 6. Schematic of tramlines.
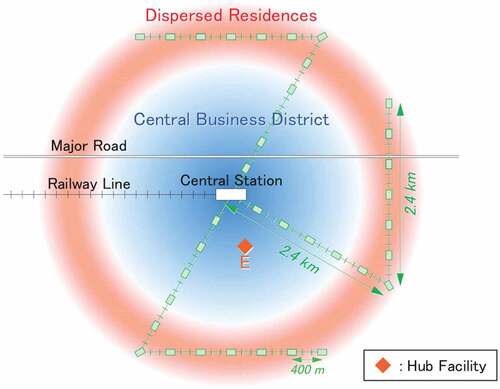
Figure 7. Linked trips using tram.
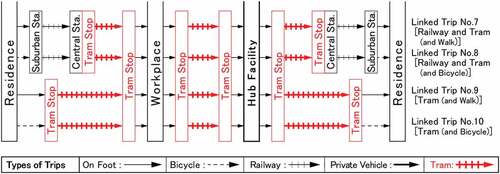
Figure 8. Final distribution of residences in experiment 2.
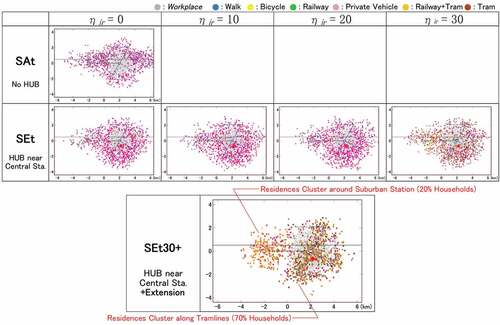
Table 4. Results of each indicator in experiment 2.
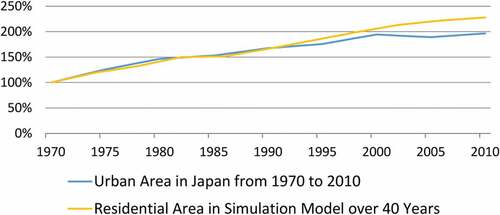
Figure 9. Shift in urban area in Japan and residential area in the model.