
Figures & data
Figure 1. Urban agriculture, local economic development, and climate change linkages.
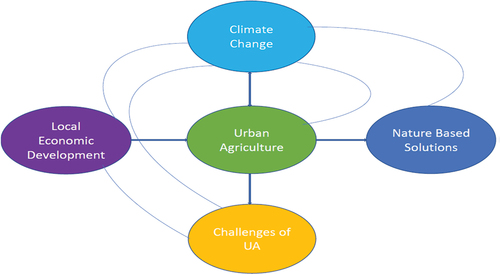
Figure 2. Flow chart of the vegetable supply chain in urban and peri-urban areas.
Source: Azunre et al. (Citation2019)
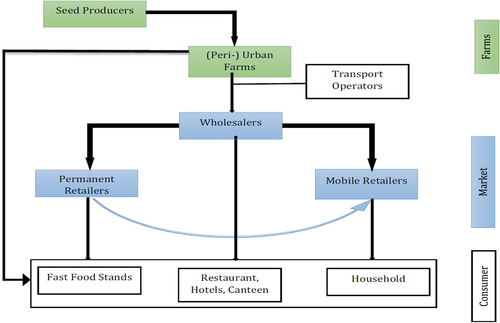
Figure 1. Urban agriculture, local economic development, and climate change linkages.
Figure 2. Flow chart of the vegetable supply chain in urban and peri-urban areas.