Figures & data
Fig. 1 The data-generating mechanism if treatment can affect the outcome, represented according to Mohan, Pearl, and Tian (Citation2013). Each directed line represents a causal relationship from a variable to another. Z = random assignment; Xt = whether the patient complies with the treatment at time t; RYt = the response indicator at time t; Yt= the real value of HAM17 in a patient at time t; Yt* = the observed HAM17 value at time t. See text for details.
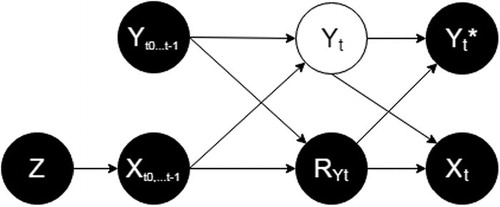
Fig. 2 The data-generating mechanism if treatment never affects outcome, represented according to Mohan, Pearl, and Tian (Citation2013). Each directed line represents a causal relationship from a variable to another. Z = random assignment; Xt = whether the patient complies with the treatment at time t; RYt = the response indicator at time t; Yt= the real value of HAM17 in a patient at time t; Yt* = the observed HAM17 value at time t. See text for details.
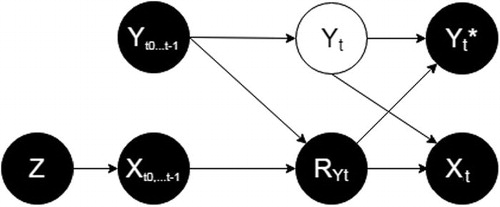
Table 1 Some of the parameters allowed to vary at each simulated trial and their allowed range.
Table 2 Bias, coverage, length of the 95%CI, and mean squared error (MSE) for the 10,000 simulations performed under the existence of a treatment effect.
Table 3 Bias, coverage, length of the 95%CI, and mean squared error (MSE) for the 10,000 simulations performed under the absence of a treatment effect.
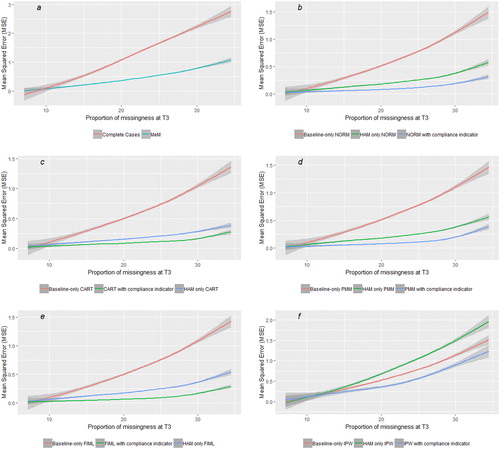
Fig. 3 Relationship between proportion of missing outcomes and mean squared error (MSE) with each of the methods in presence of a treatment effect. (a) The performance of static methods for context, (b–f) how—regardless of the method, the inclusion of post-baseline values and of a compliance indicator increases the accuracy of the estimates, and that such gain in accuracy increases with the proportion of missingness. Lines are smoothed with span = 0.7 and areas in gray represent the 95% CI.