Figures & data
Fig. 1 A directed acyclic graph encoding the causal assumptions regarding the data generating mechanism under the null hypothesis without an effect of the investigational treatment on the outcome (scenario 1). Observed variables are represented as squares, unobserved as ellipses.
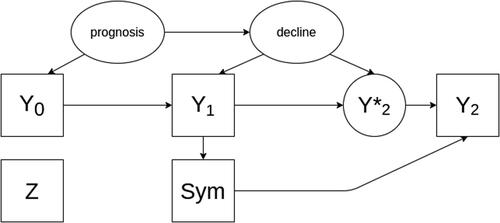
Fig. 2 A directed acyclic graph encoding the causal assumptions regarding the data generating mechanism under the alternative hypothesis with an effect of the treatment on the outcome (scenario 2). Observed variables are represented as squares, unobserved as ellipses.
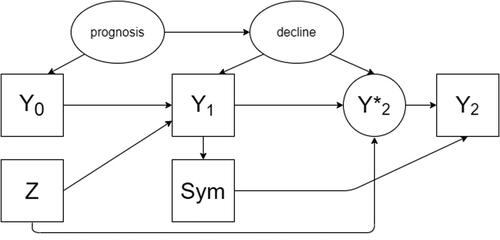
Fig. 3 Illustration of simulated scores. Each line represents the progression of a simulated patient, measured at baseline and after 1 and 2 years. Blue dots are values measured in patients receiving placebo, orange dots values measured in patients receiving the investigational disease modifying treatment. The distribution for each group is described at each of the three timepoints as box-and-whiskers (in blue for patients receiving placebo, in orange for patients receiving the investigational disease-modifying treatment).
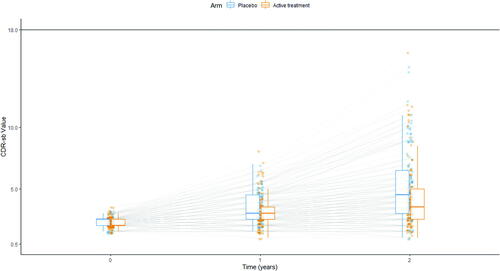
Table 1 Performance of estimators under the null hypothesis without unmeasured confounding, scenario 1.
Table 2 Performance of estimators under Scenario 2, in presence of treatment effect and in absence of confounding between intercurrent event and decline.
Fig. 4 Distribution of biases for the trials under the null hypothesis (scenario 1). Methods that use post-IE data are plotted in blue and methods that discard post-IE data are plotted in red.
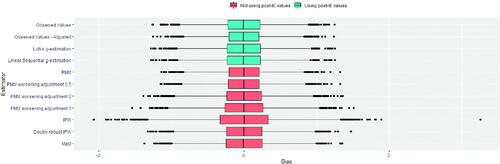
Fig. 5 Distribution of biases for the trials under the alternative hypothesis (scenario 2). Methods that use post-IE data are plotted in blue and methods that discard post-IE data are plotted in red.
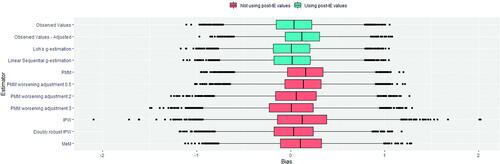
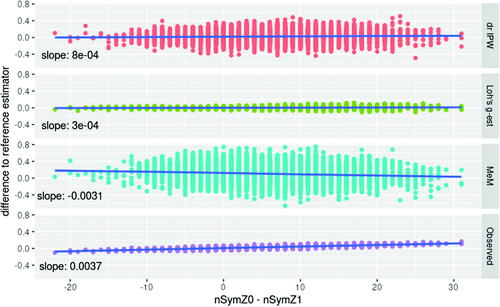
Fig. 6 Dependency between the performance and the difference in starting symptomatic treatment between treatment groups in scenario 2. The difference between the candidate estimator and the reference estimator depends on the difference in starting symptomatic treatment between treatment groups for the Mixed effects Model (MeM) setting values after initiation of symptomatic treatment to missing, and using the observed values in a linear model (Observed). No such dependency is observed for Doubly Robust IPW (drIPW) and Loh’s g-estimation (Loh’s g-est).