Figures & data
Figure 1. Tensile stress–strain, breakdown strength and actuation measurements.
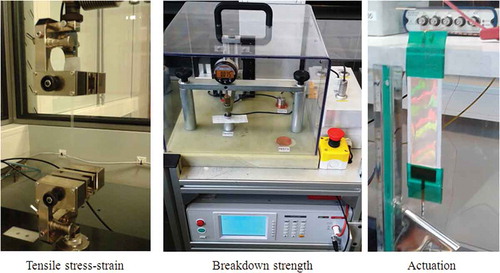
Figure 2. Thermal degradation analysis of the LSR and RTV films.
Table 1. Thermal properties of the LSR and RTV films.
Figure 3. Breakdown strength versus filler content as determined from the TGA of LSR and RTV films. All films are of similar thickness (60–80 μm).
Table 2. Weibull analysis parameters for LSR and RTV samples.
Figure 4. Tear strength of the LSR and RTV films. The results are summarized in .
Table 3. The mechanical properties of LSR and RTV films.
Figure 5. Dynamic viscosity of the XLR–TiO2 mixtures at 23°C.
Figure 6. Frequency-dependent relative permittivity spectra of the pure XLR and XLR–TiO2 elastomers at 23°C.
Figure 7. Frequency-dependent dielectrical loss tangent spectra of the pure XLR and XLR–TiO2 elastomers at 23°C. The observed relaxations are Maxwell relaxations.
Figure 8. Tear strength of the pure XLR and XLR–TiO2 elastomers.
Figure 9. Stress and elongation at breaking in the tear experiment on the pure XLR and XLR–TiO2 elastomers.
Figure 10. SEM images of R420 TiO2 filler (a), pure XLR film (b) and XLR+35 wt.% R420 TiO2 film (c).
Table 4. Mechanical properties and breakdown strength of the XLR–TiO2 films. The optimum of a given property is marked in gray.
Figure 11. 3D plot of breakdown strength as a function of the Young’s modulus and filler amount for the XLR–TiO2 (R420) films and the pure LSRs.
Figure 12. 3D plot of breakdown strength as a function of the Young’s modulus and filler amount for the MJK 4/13-TiO2 (T805) films.
Table 5. Weibull analysis parameters for XLR–TiO2 and RTV–TiO2 samples.
Table 6. Dielectric and mechanical performances and figures of merit (Fom) of the LSR–TiO2 and RTV–TiO2 formulations. Optimal properties are marked in gray.
Figure 13. Actuation curves for pure XLR and XLR+35 wt.% TiO2 films at 23°C.