Figures & data
Table 1. Modification types of CNTs and their composites with rubber matrices.
Table 2. Mechanical properties of elastomeric/CNT nanocomposites.
Table 3. Percolation threshold of CNT/elastomeric composites and their hybrids compounds.
Table 4. TGA results for the SBR and NBR reinforced with multiwall carbon nanotubes under N2 atmosphere [Citation63].

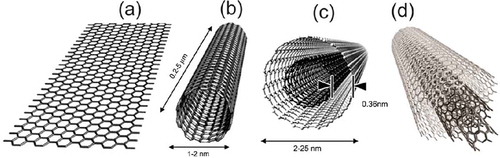
![Figure 2. Schematic diagram showing how a hexagonal sheet of graphite is ‘rolled’ to form a carbon nanotube. Reprinted from reference [Citation4].](/cms/asset/5168b876-28f9-438f-8b90-16ed88021cd5/tsnm_a_1121632_f0002_b.gif)
![Figure 3. Illustrations of the atomic structure of (a) an armchair and (b) a ziz-zag nanotube. Reprinted from reference [Citation4].](/cms/asset/d166d45c-b86e-4d2d-861d-45efed02fa2d/tsnm_a_1121632_f0003_b.gif)
![Figure 6. Various covalent functional modifications possible with carbon nanotubes. Reprinted from reference [Citation52].](/cms/asset/26c6a6de-1fa6-4fe4-a3c6-c55c0392294e/tsnm_a_1121632_f0006_b.gif)
![Figure 7. A schematic representation of adsorption behavior of surfactants onto the surface of CNTs. Reprinted from reference [Citation59].](/cms/asset/8b5562de-9ca5-4f35-9c93-9a9a9c05362d/tsnm_a_1121632_f0007_b.gif)
![Figure 8. TEM images of SBR-MWCNT composite (0.75 phr) prepared by (a) a rotation–revolution mixer, (b) Banbury mixer [Citation109]; TEM images of NR composite filled with 1% of (c) unmodified CNT, (d) acid-treated CNT [Citation60]; SEM micrographs of NR composites filled with (e) acid-treated MWCNTs, (f) unmodified MWCNTs [Citation61]; SEM images of CNT-filled rubber composite containing 7 phr CNT: (g) without stretching; (h) at 15% stretching [Citation113].](/cms/asset/94fa0839-67d9-414a-a99a-466b4a4ac24f/tsnm_a_1121632_f0008_b.gif)
![Figure 9. AFM and EFM images of CNT dispersion in elastomeric matrix: (a) AFM images of composite with 2.8 wt% MWCNT before coagulation, (b) after coagulation of the latex beads at 60°C [Citation24], (c) EFM phase image at 0 V, and (d) EFM phase image at 7 V of NBR-MWCNT composite [Citation116].](/cms/asset/42100569-b92b-49d6-b7f3-7fb221940c62/tsnm_a_1121632_f0009_c.jpg)
![Figure 10. Raman spectrum of MWCNT, MWCNT-rubber, and MWCNT-IL-rubber composites. IL represents an ionic liquid of 1-allyl-3methylimidazolium chloride, and the MWCNT loading was 3 phr [Citation82].](/cms/asset/1ef472df-070b-445f-baec-e2b018f0537b/tsnm_a_1121632_f0010_b.gif)
![Figure 11. (a) Stress–strain curves of NR, NR/CNT, and NR/CB compounds and (b) storage modulus of NR/CNT and NR/CB compounds at different filler loadings as a function of dynamic strain amplitude [Citation114].](/cms/asset/69b48ab1-7744-4931-aabb-204a7761ee07/tsnm_a_1121632_f0011_b.gif)
![Figure 13. Dependence of CNT loading on the volume resistivity of NR, SBR, and EPDM composites [Citation87].](/cms/asset/9ea7a906-15cf-4cb5-9112-e23ef2703b35/tsnm_a_1121632_f0013_b.gif)
![Figure 14. TGA thermograms (a) and corresponding DTG curve (b) of pure silicone rubber (SR) and SR/MWCNTs nanocomposites [Citation140].](/cms/asset/4ad593f6-1397-4043-a4e6-8bc8691bdde6/tsnm_a_1121632_f0014_c.jpg)